Market Update June.21, 2022
A potential recession is looming, what is the fed going to do? Bullish for precious metals moving forward and not for general stocks.

Things have continued to deteriorate with a quickening pace in the stock market, I am happy to say I have been telling subscribers to use caution going all the way back to January. We have a situation where the fed is likely going to cause a significant recession and we are arguably already in one.
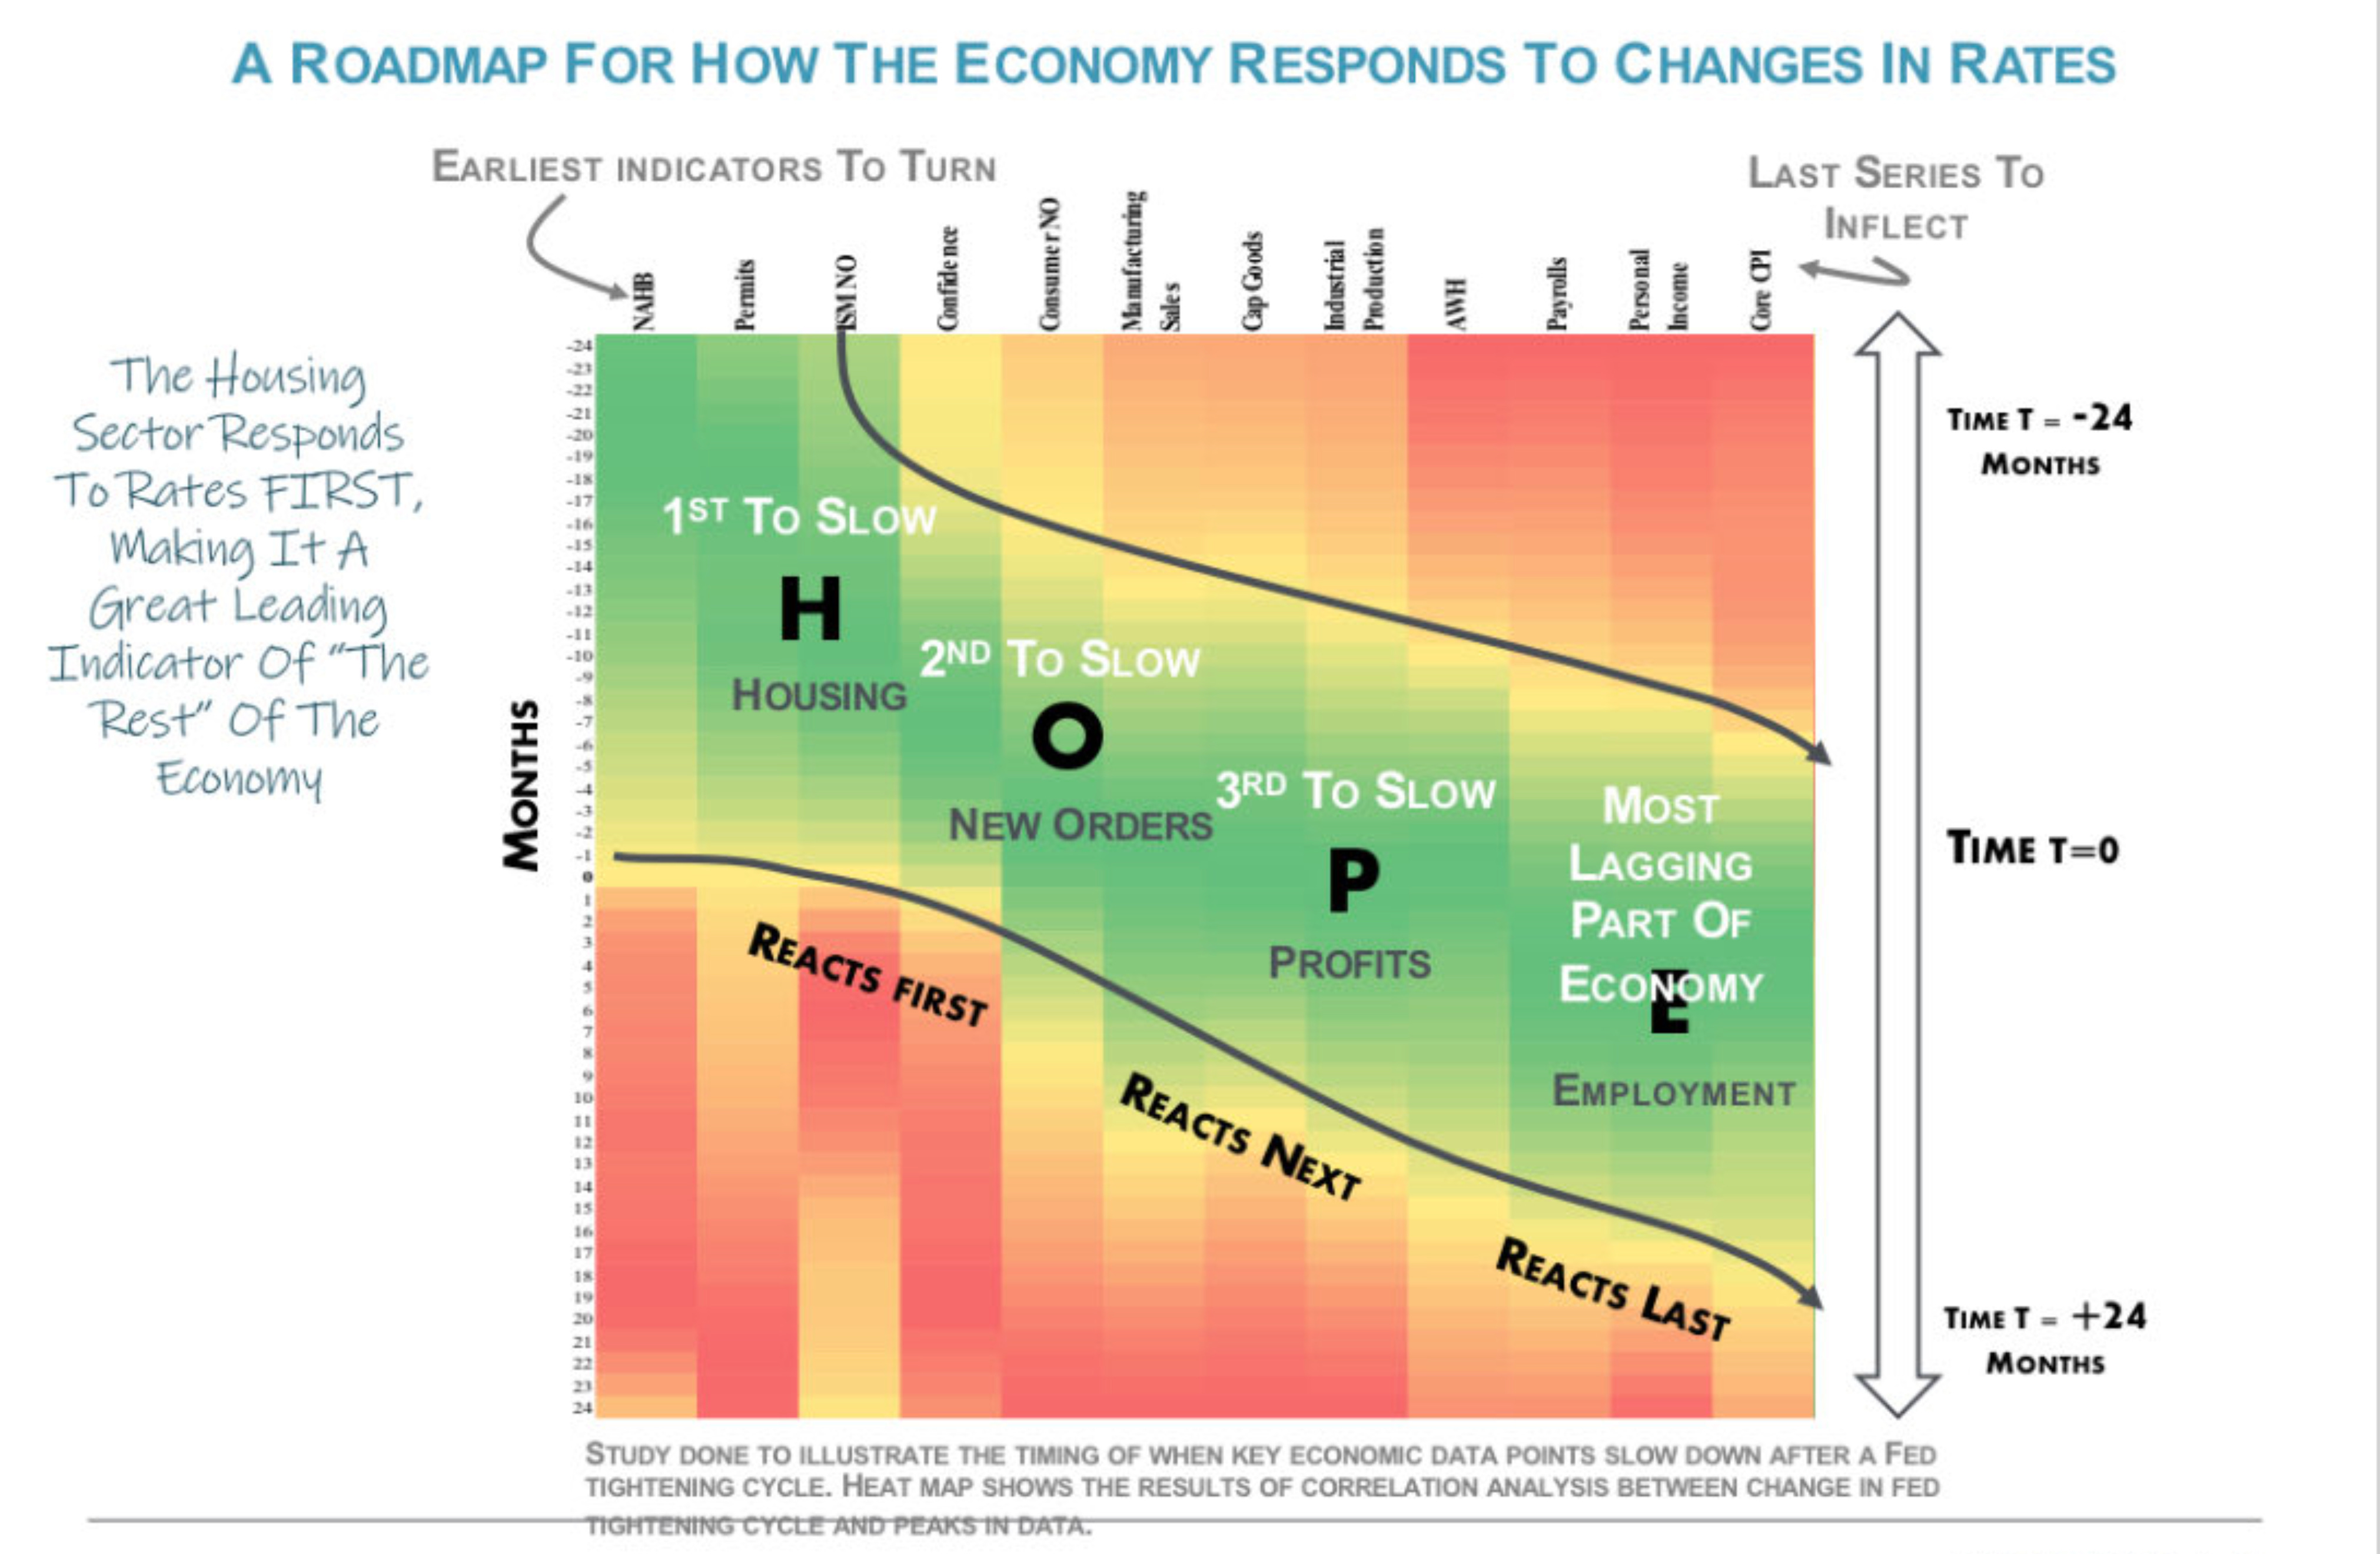
I believe the fed is going to light the fire under the next precious metals bull market. The ultimate scenario for the metals will be inflation above target , while a recession starts to take hold, forcing the fed to pivot and direct attention to the next problem. We are already seeing signs that the housing market is rolling over and that is usually one of the leading indicators for the health of the economy. This is a really good chart demonstrating how things are likely to play out.
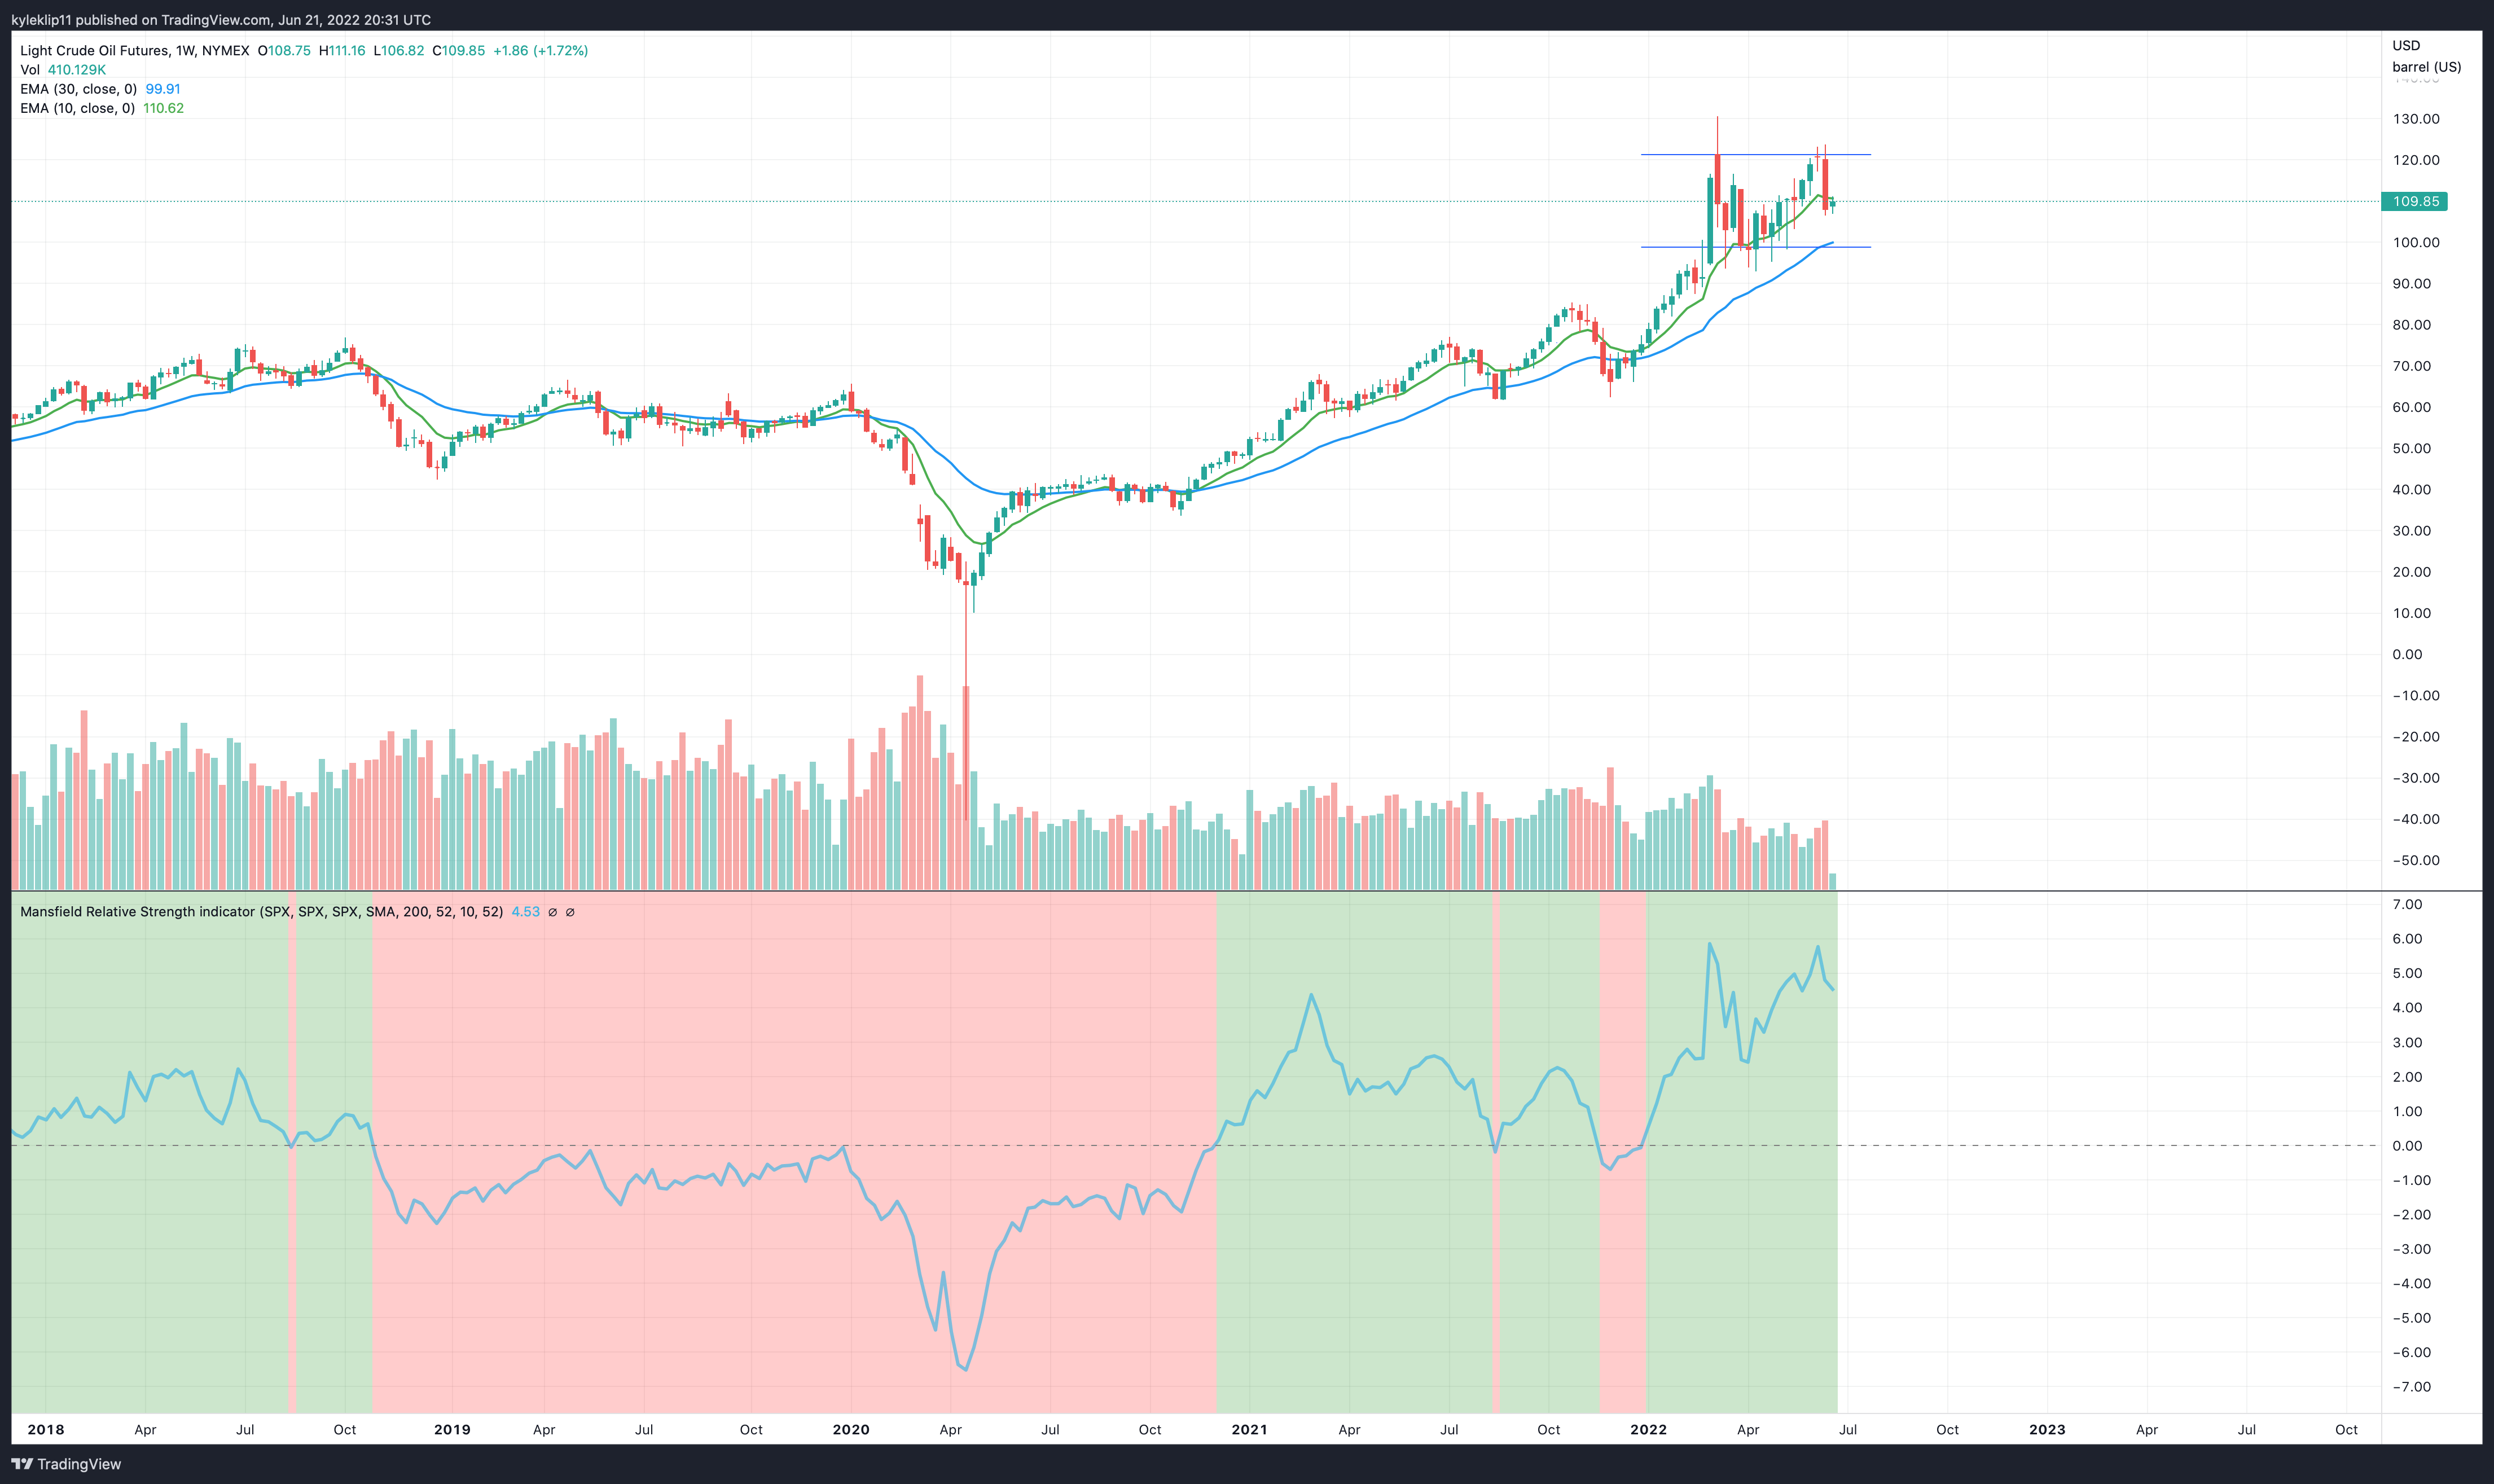
The oil chart is an important one to watch, as the chart looks like it could have potentially put in a double top which would have large implications for the inflation numbers moving forward. It’s important to remember that prices could remain the same as they are today and inflation would flatline, as the CPI is continuously measuring the rate of change.
Oil Weekly - Double Top? Something to watch moving forward.
Let’s take a look at the weekly charts for the indices, which are very indicative of overall market health. There has been so much damage done, that now is the time to just sit back and wait and see if we can retake some of these moving averages. It’s possible commodity type stocks could diverge at some point but we will just to have to wait and see on that. If something started to work well right now, it would likely create a mania as people will move money into whatever is working at the time. Could be interesting for a sector like silver mining stocks for example.
S&P 500
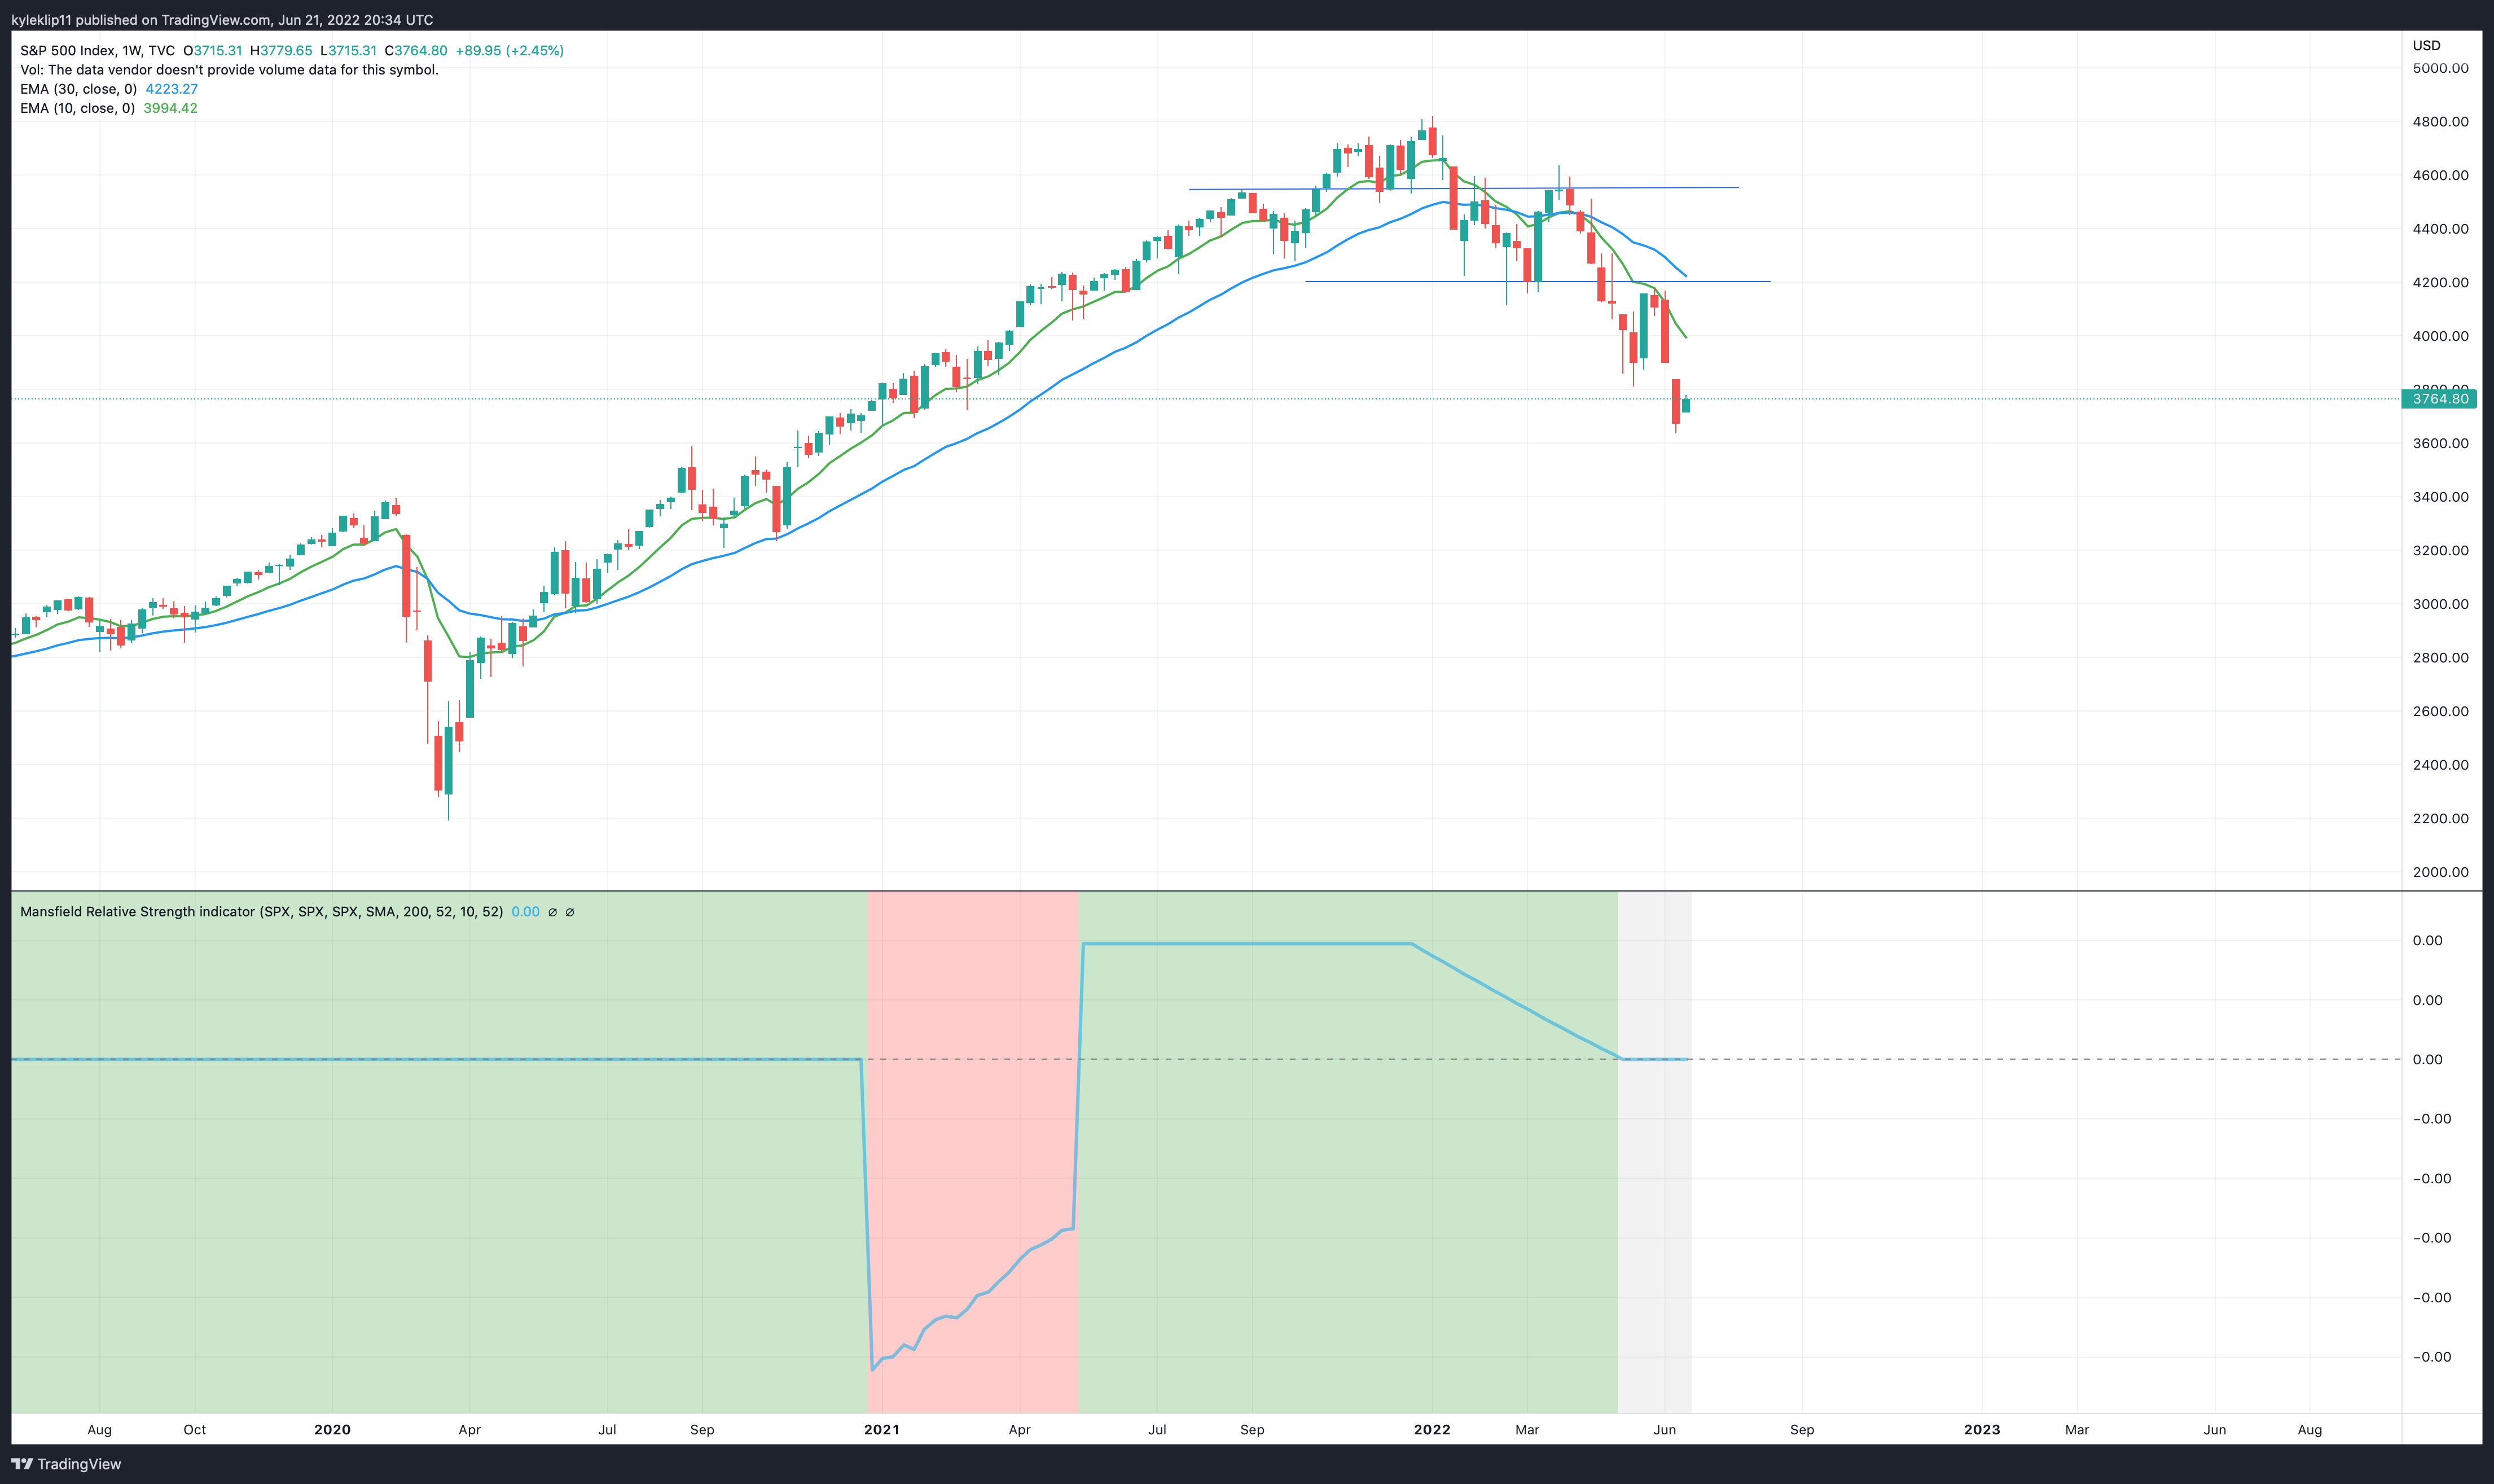
Note - This is in a stage 4 decline and without the fed bringing out the printer likely isn’t going to recover anytime soon. The 50 Day EMA ( green line) has acted as pretty solid resistance for quite a few weeks. A bounce back to re-test that level would not surprise me at this point.
Nasdaq
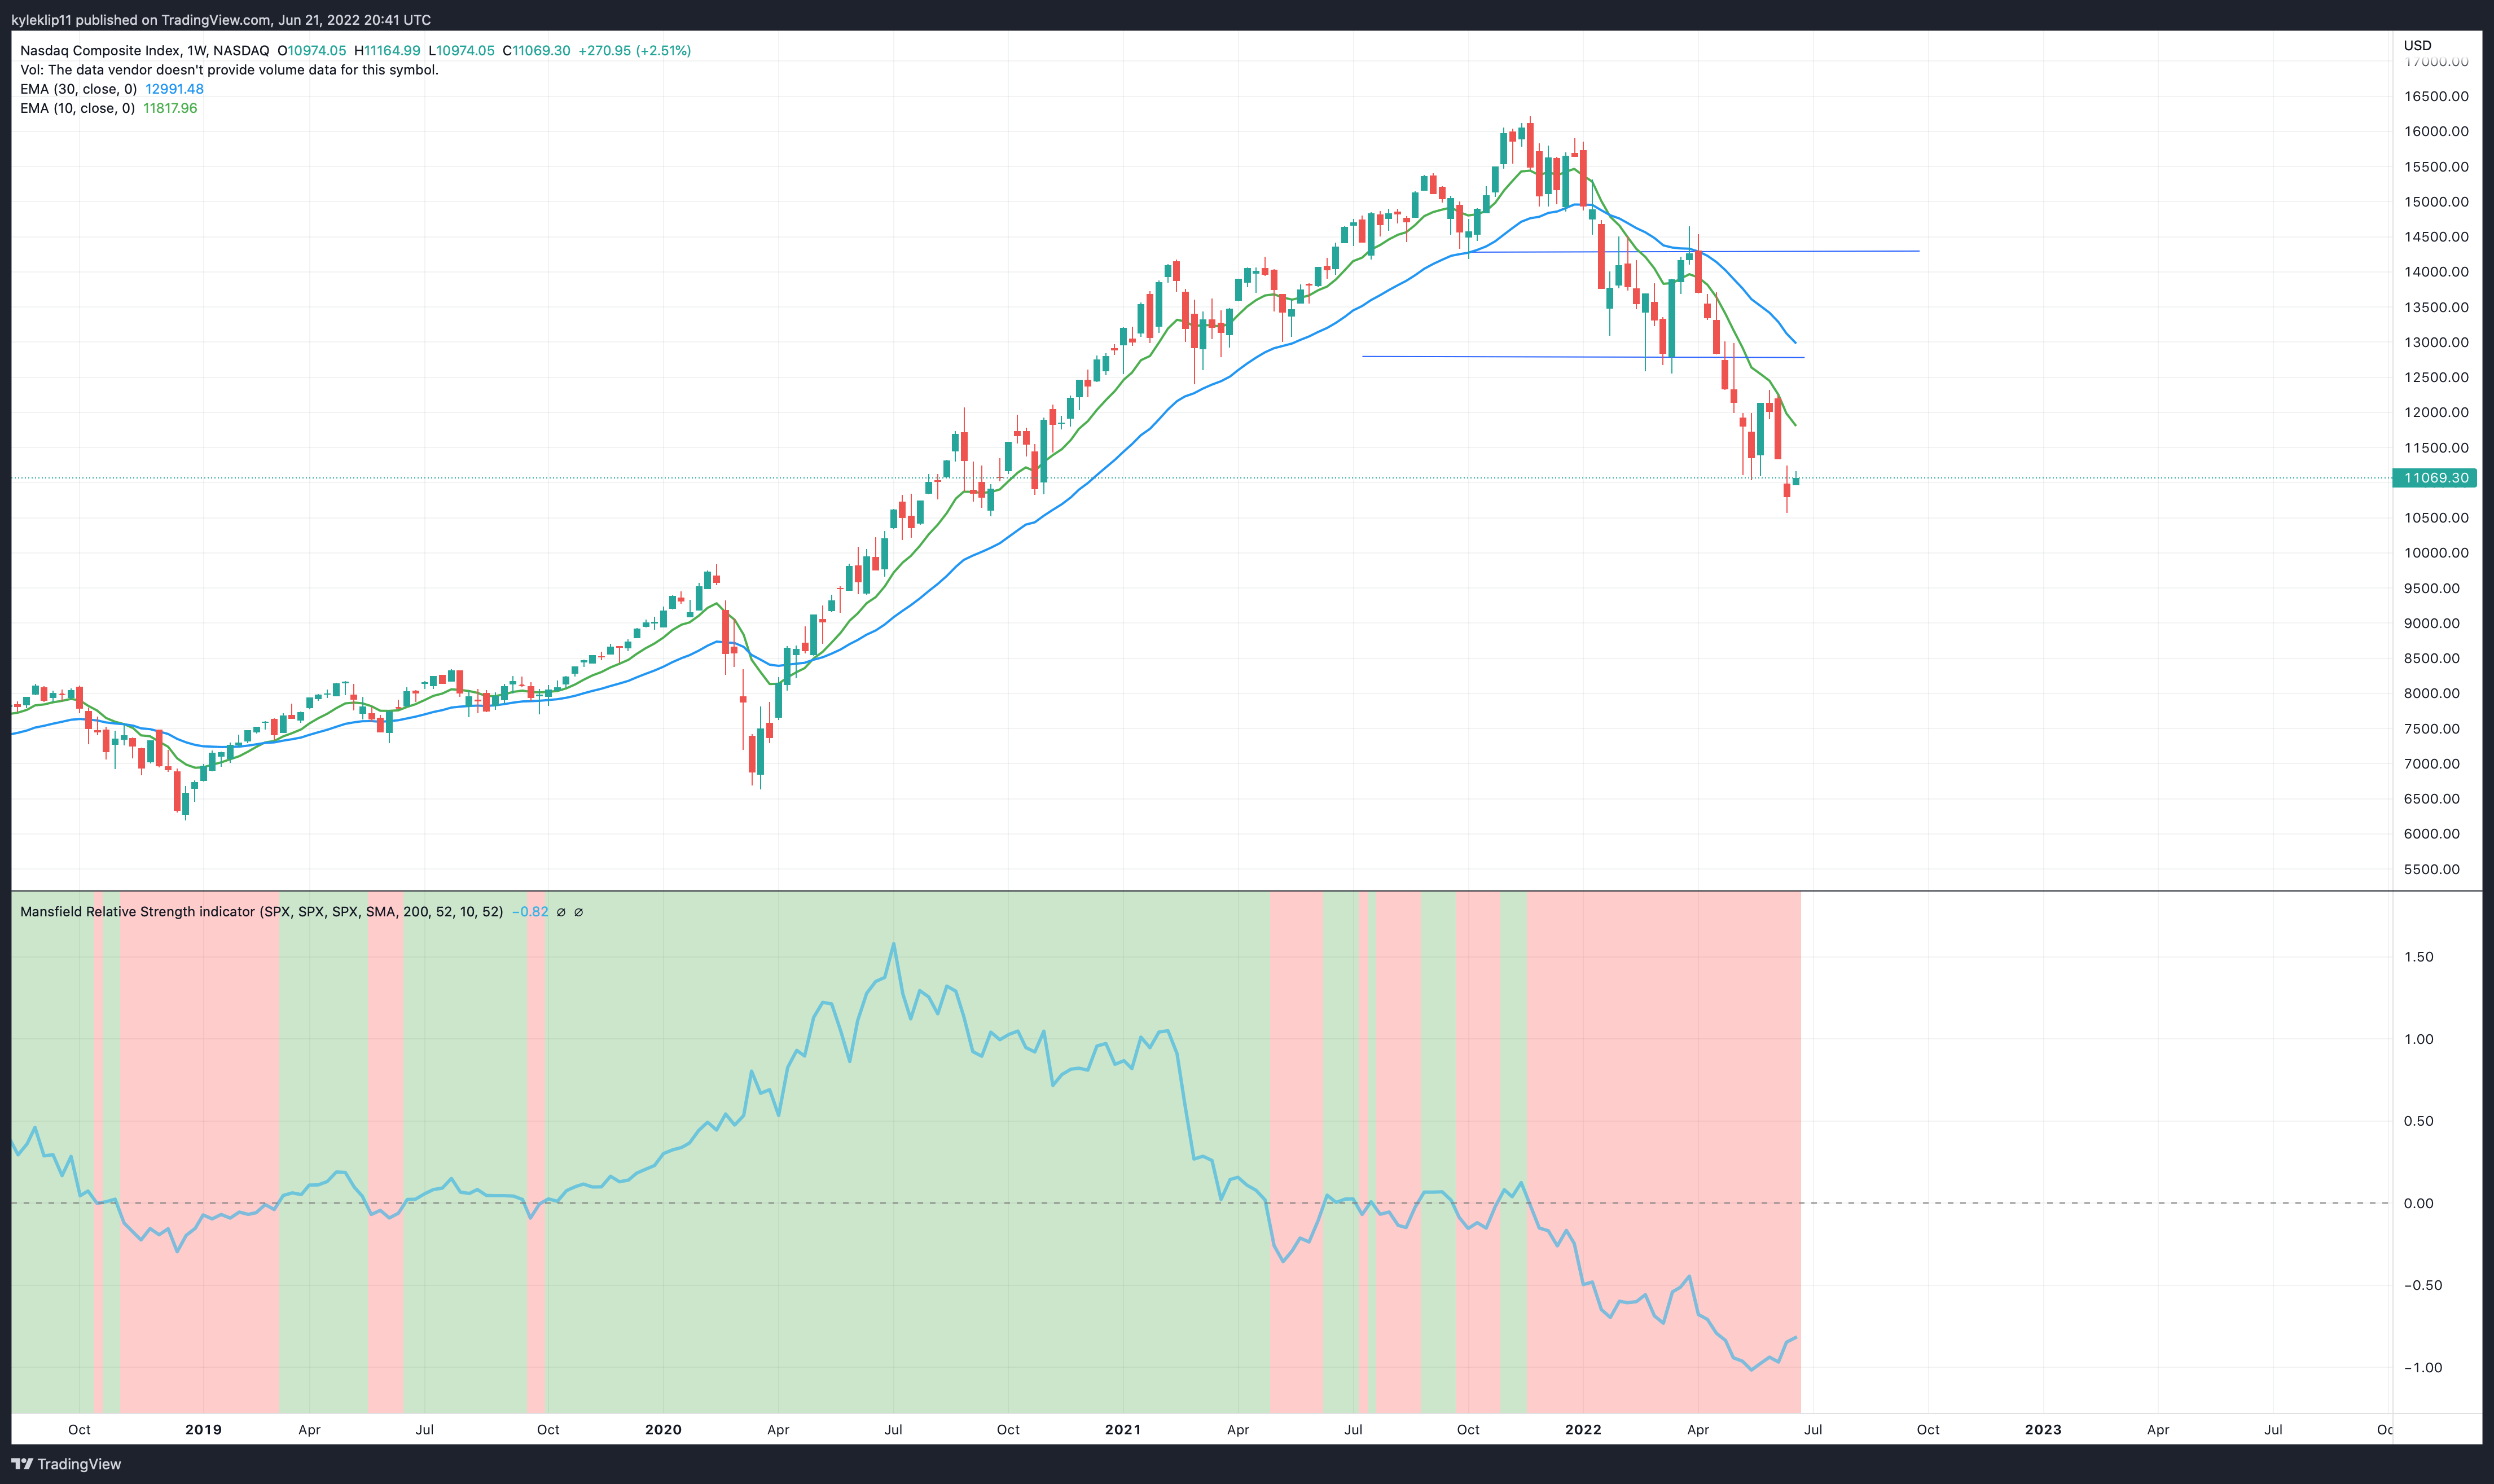
Note - Looks very similar to see the SPX chart, if this breaks the $10500 level on a weekly close, we could see all the covid 2020 gain wiped out. Talk about capital destruction. This is why it’s so important to know when to sell and not hold the bag. I have learned this lesson the hard way before.
Dow Jones Industrial Average
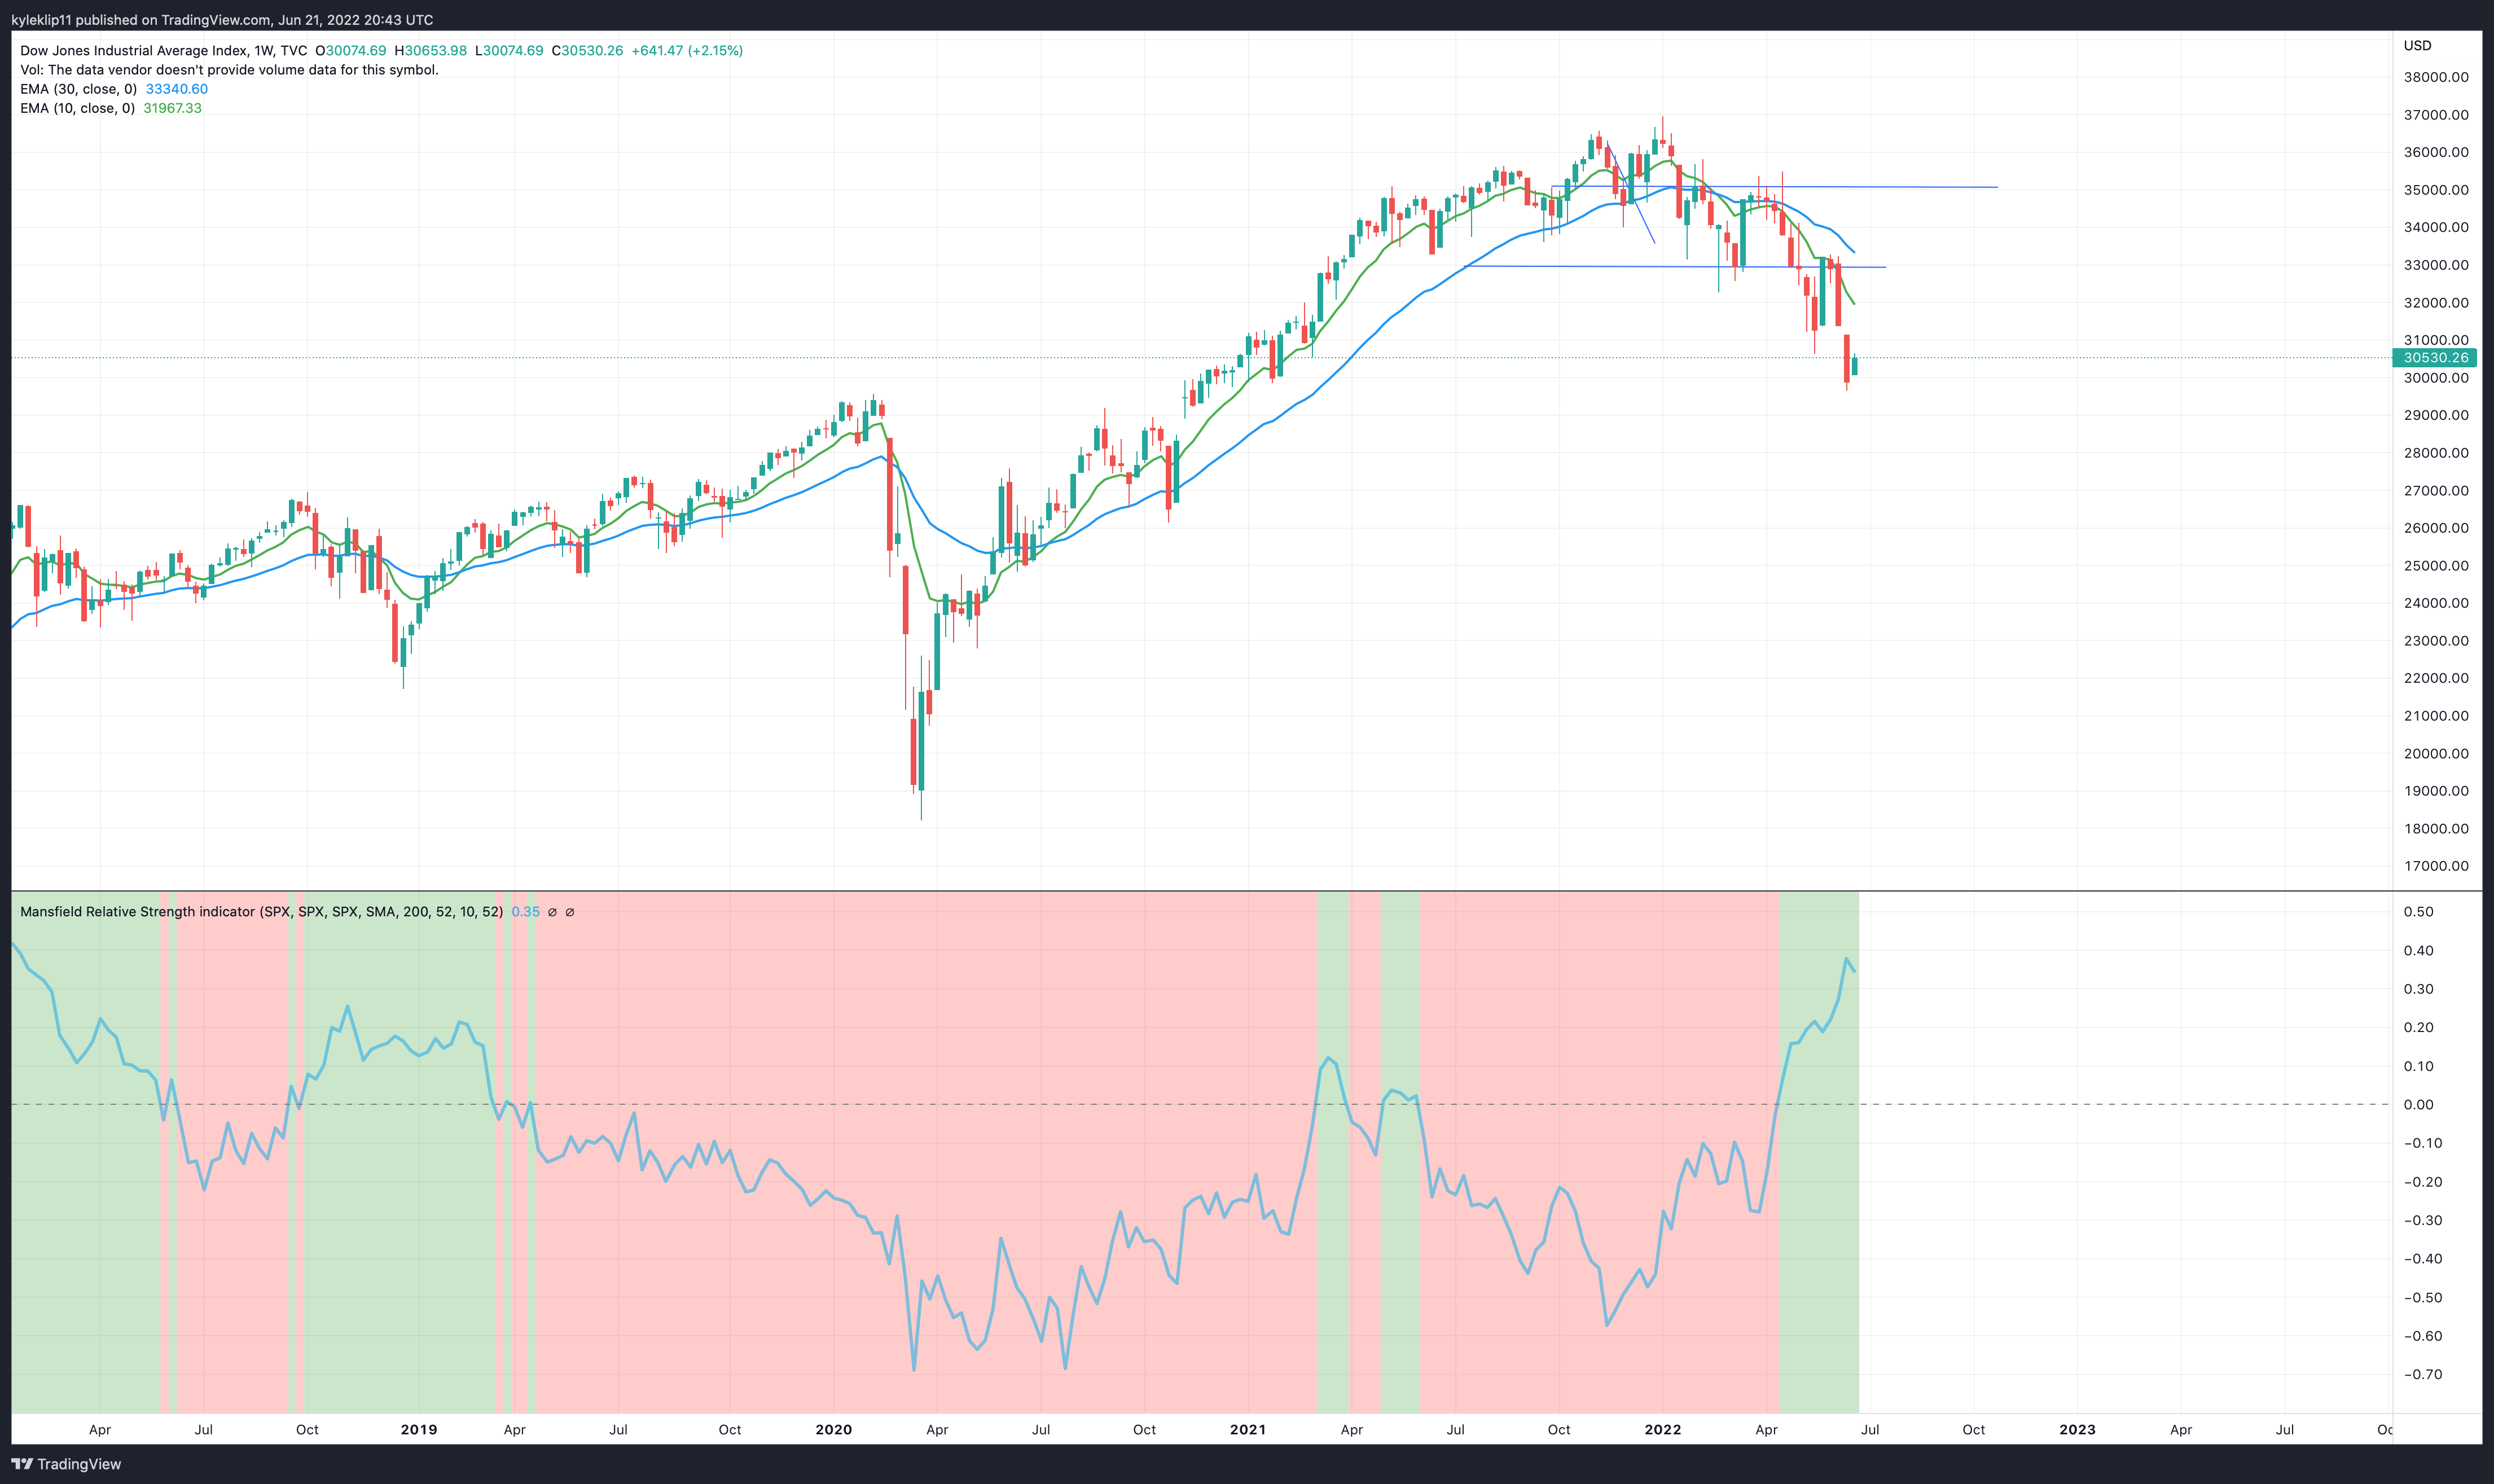
Note - If that recession scenario plays out, this is likely going much lower, it’s held up better than the other indices, but has been rolling over more aggressively recently. One to watch moving forward.