Weekly Report - June.20, 2026
Tracking Institutional Footprints and Relative Strength in the Junior Uranium Space

It was another volatile week in the markets, and once again, there wasn't much out there for Stage 2 breakouts. On the commodity side, we continued to see the oil and gas complex get destroyed. In my view, this selling is overdone and is turning into an excellent opportunity. On the flip side, we saw big moves in uranium stocks to end the week. Nuclear energy remains one of the absolute highest-conviction areas of the market on my radar, and it’s a space I am paying very close attention to right now.
Recent Feature Update: Atlas Salt Inc. (TSXV: SALT)
I want to take a moment to highlight a couple of recent wins from our premium coverage, starting with Atlas Salt. I dropped a detailed report in early May highlighting the massive potential of this name, and it remains an incredibly high-conviction play for me.
When I first featured the company, the stock was at $1.17 CAD. It is currently trading at $1.63 CAD, which represents a spectacular ~40% return in just over a month.
I continue to comfortably hold my core position here. What impresses me the most about this tape is the sheer depth of the underlying demand: even after the company announced and closed a massive, upsized bought deal financing at $1.20 per share, institutional buyers completely plowed right through that overhang. Normally, a massive financing causes a stock to pull back or churn for weeks. Instead, the market absorbed every bit of that paper and immediately pushed the stock higher, proving that smart money is aggressively positioning for a major Stage 2 advance.
Another interesting development this week was watching the copper explorer we highlighted last week for premium members put together another absolutely explosive week. The stock surged nearly 30% in just five trading days—a perfect example of the sheer torque and firepower you get when a major base metal discovery catches fire. These are the exact types of high-volume, institutional Stage 2 structures we screen for every single week.
Notes from the week -
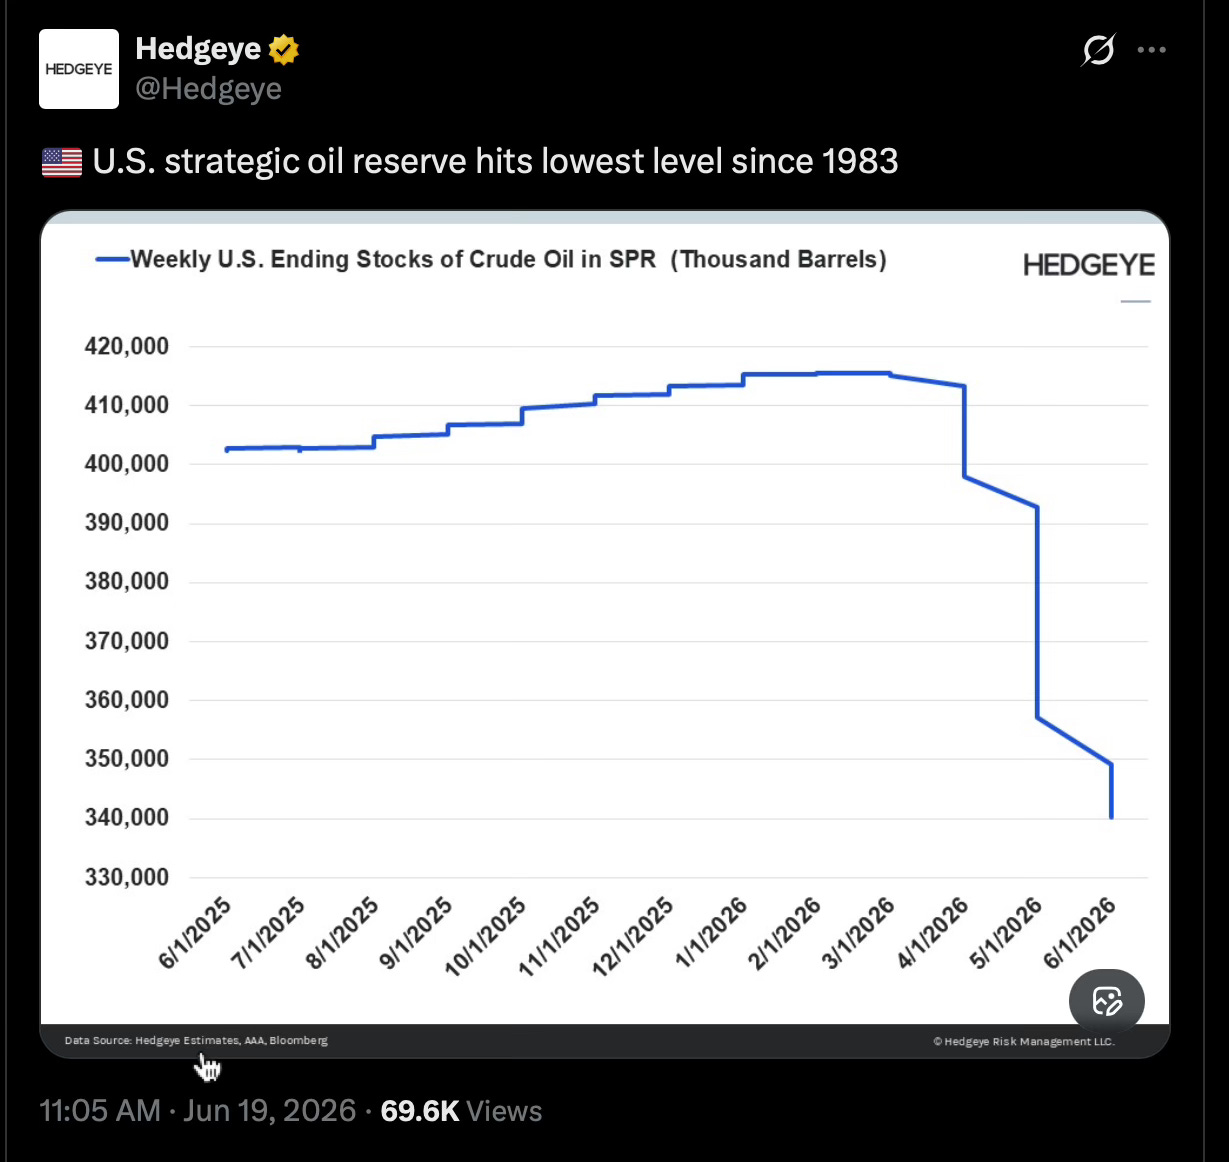
SPR Depletion
The market is actively panicking out of oil and gas equities right now, yet the U.S. emergency stockpile just crossed a 43-year low. This disconnect hasn’t mattered to the algorithms yet, but it represents a massive structural tailwind.
The current administration has already noted they plan to fill these caverns back up. This replenishment mandate essentially acts as a permanent, price-insensitive buyer of oil. When you realize other major global powers are sitting with similarly depleted strategic stockpiles, it becomes incredibly clear that this oil flush-out is wildly overdone and setting up an exceptional contrarian buying window
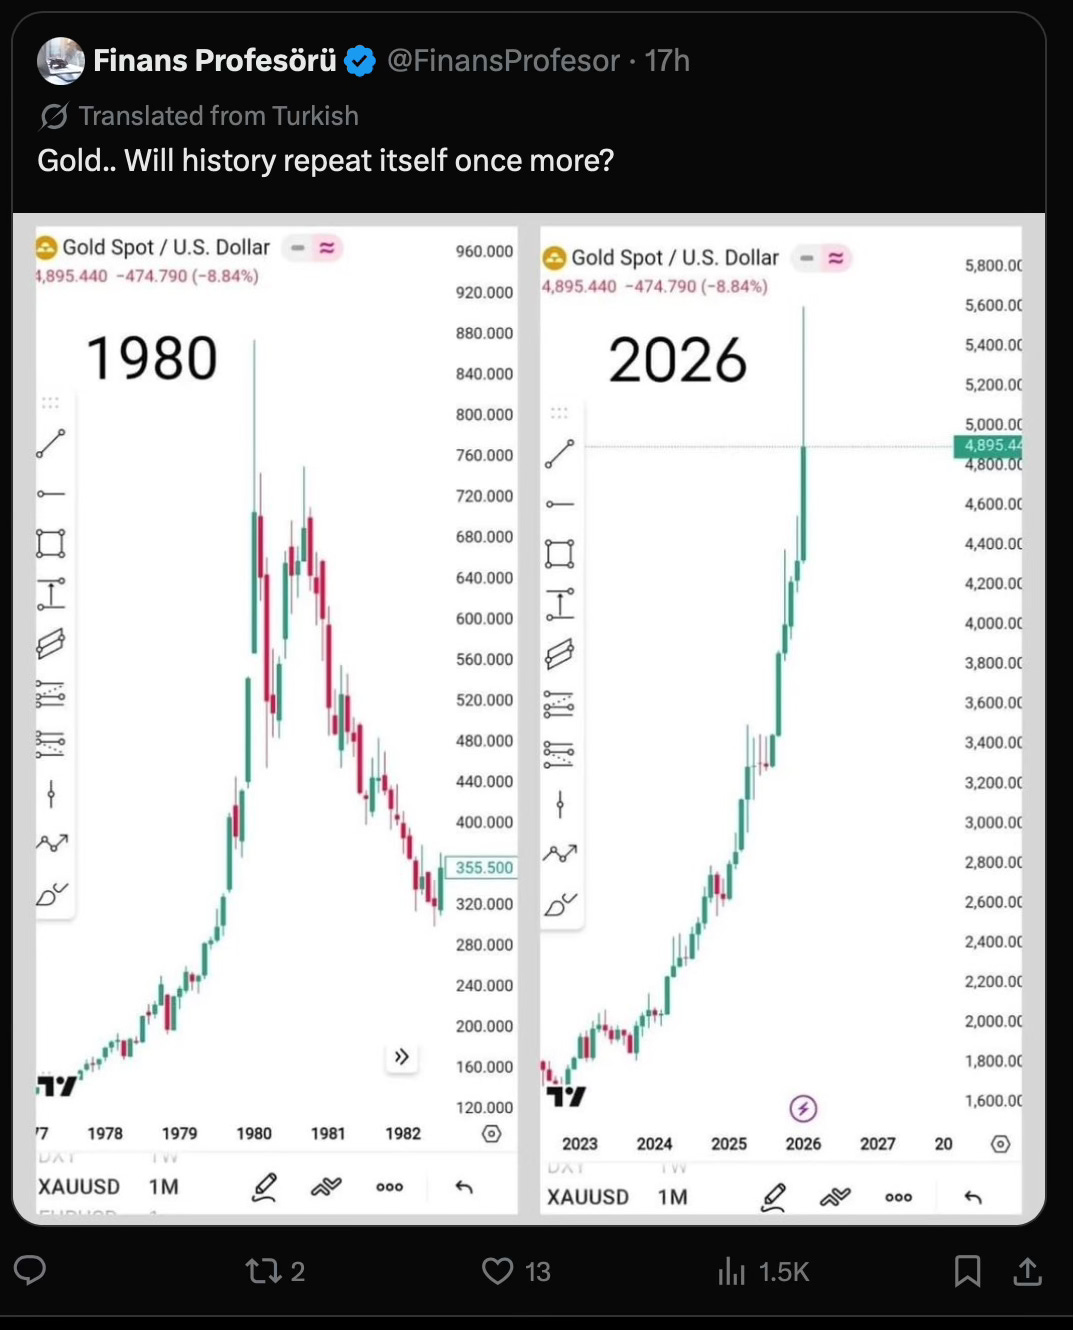
Precious Metals: Welcoming the Flush
Precious metals have been getting absolutely hammered lately, and it is highly intriguing to watch the paper market unwind. The current monthly chart structure of spot gold is drawing eerie, 1-to-1 fractional comparisons to the catastrophic post-peak collapse of 1980.
With gold falling precipitously off its late-January highs back toward the low-$4,000 range, the sentiment shift has been swift and brutal. If this historical analogue plays out and history truly repeats itself, junior and senior mining stocks may be forced to return to structural pricing levels not seen in a couple of years.
Personally? I continue to welcome this scenario with open arms.
A severe flush-out in the paper market doesn’t alter the reality of global currency debasement or unbacked sovereign debt expansion. I would absolutely love the opportunity to add to my physical holdings at a steep, liquidation-driven discount. Long term, there are very few asset classes left on earth that present a safer, more asymmetric place to park hard capital when the macro music finally stops.
If the market wants to hand us multi-year lows on premium gold and silver producers because of near-term liquidations, we should be prepared to step up and catch the generational entries.
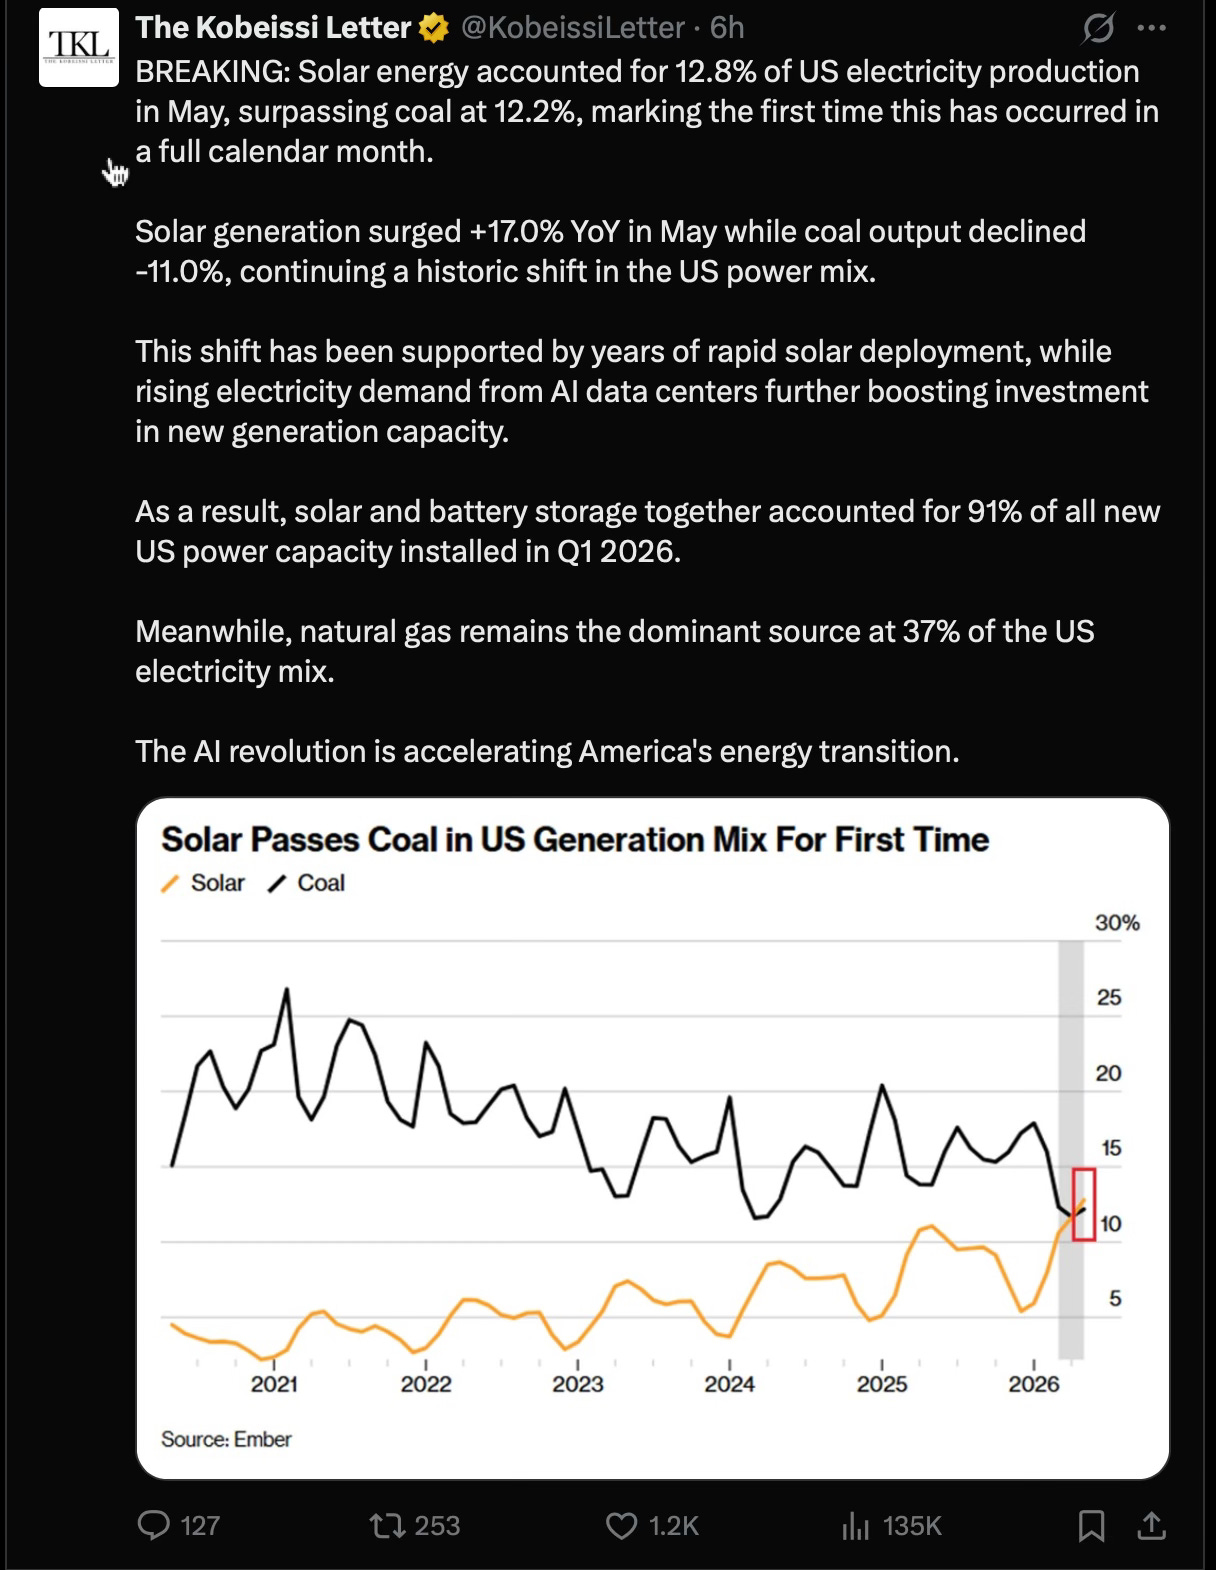
Solar surpasses Coal
I stumbled across an incredibly interesting chart this week, and quite frankly, I was surprised to see just how exponentially solar has grown.
Solar energy officially accounted for 12.8% of US electricity production in May, completely surpassing coal at 12.2%. This marks the first time in history that this has occurred in a full calendar month. This is an absolutely massive milestone. Solar generation surged an incredible +17.0% year-over-year, while coal output continued its structural decline.
What a lot of general macro investors are completely missing here is the industrial link: this is an incredibly bullish fundamental driver for silver long term.
Silver is a critical, non-substitutable component in photovoltaic (solar) cells. With solar and battery storage accounting for a massive 91% of all new US power capacity installed in Q1 2026, the structural demand curve for physical silver isn’t just growing—it’s accelerating.
While the paper precious metals market can get flushed out and manipulated in the short term, this explosive green energy expansion is going to act as a powerful physical floor. This underlying industrial squeeze is exactly what may help prevent silver from structurally returning to the much lower pricing levels we’ve seen in recent years. The supply-demand deficit in physical silver is real, and the grid transition is locking it in.
The Smart Money Just Signal-Flashed a Massive Uranium Breakout
While broad equities spun their wheels this week, one unique uranium company completely forced its way onto our tracking radar. The stock didn’t just survive the volatility—it caught a massive institutional bid and surged over 30% in a single week, executing a flawless, textbook breakout right in front of us.
The technical setup is completely locked in, but the real fireworks are being driven by a massive corporate development. This week, the company announced that a true legend of the sector is stepping back into the public arena to take over day-to-day management and execute a major global growth strategy.
For serious commodity allocators, this individual is absolute uranium royalty. He is the icon who famously built a junior explorer from absolute scratch into a multi-mine, $5 billion producer, and then spent his subsequent years turning a struggling $6 million micro-cap into a massive, multi-billion-dollar development powerhouse.
For our paid members, we break down the specific company ticker, the asset footprint, and the exact chart parameters for this breakout below.