Weekly Report - May.31, 2026
Early-Stage Gold and Fertilizer Breakouts, and market commentary from the week.

Notes from the week
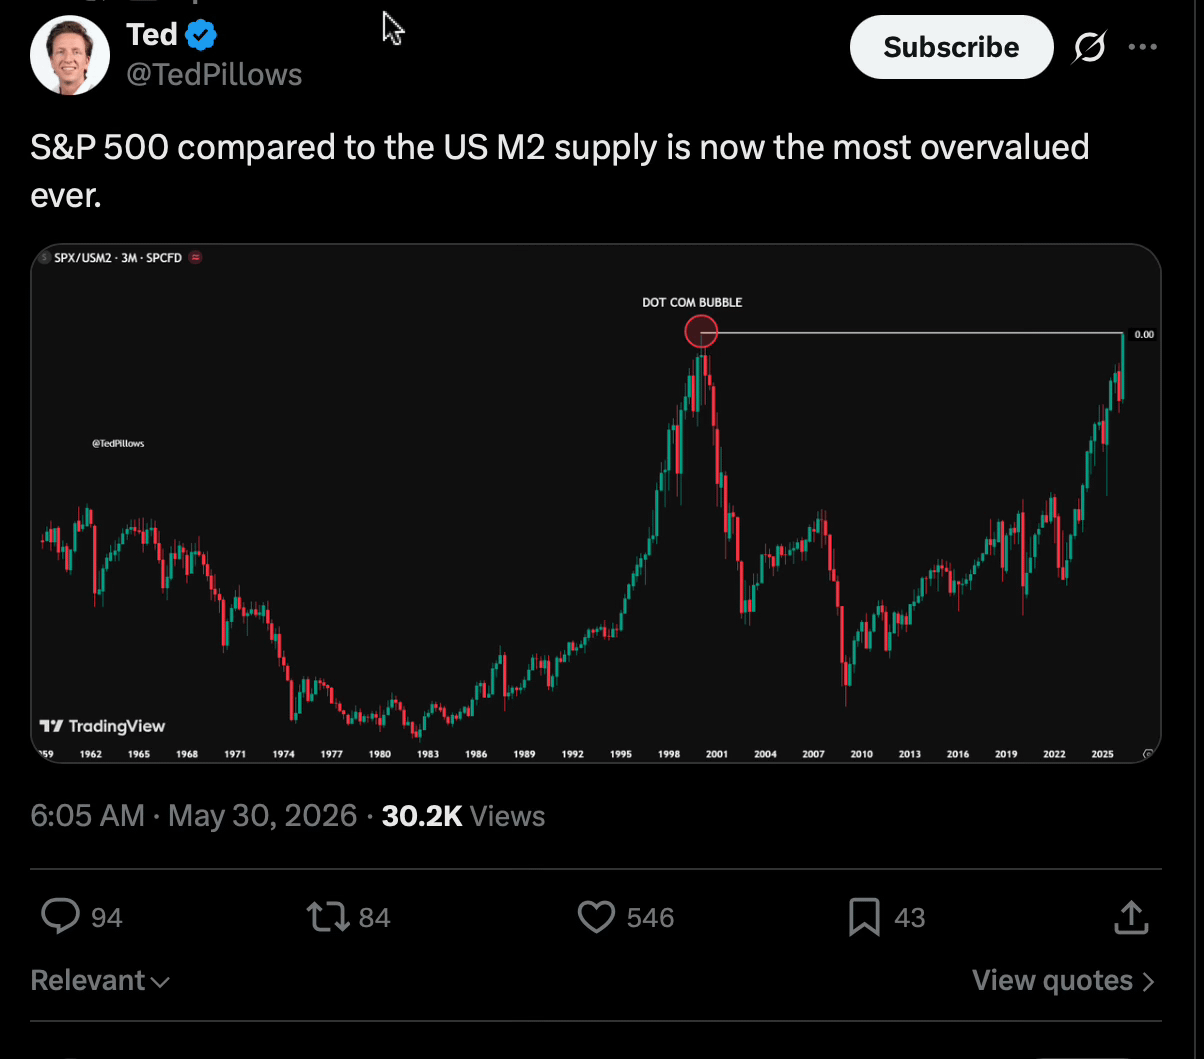
Looking at this chart which tracks the S&P 500 relative to the US M2 money supply, this is yet another warning sign that this market is in very dangerous territory. The ratio has pushed right back to its absolute historical extremes, matching the peak of the Dot Com era. With extreme concentration currently centered in AI and tech stocks, the overall environment feels more like a bubble than it has in quite some time. Interestingly after the dot com bubble burst, commodities went on some great runs throughout that decade.
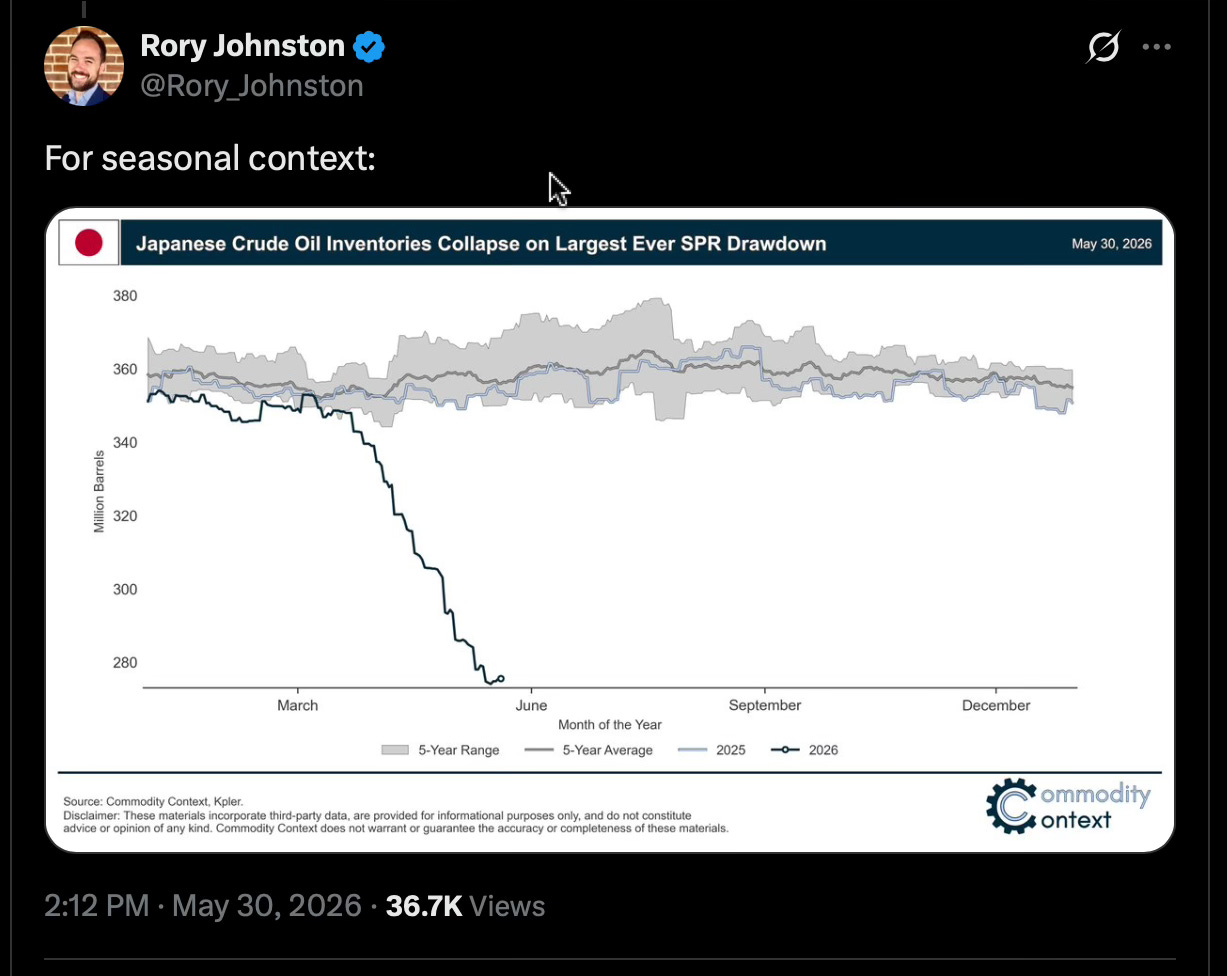
As the traffic disruption in the Strait of Hormuz continues, countries are aggressively depleting their emergency stockpiles to keep refiners supplied. Japanese crude oil inventories are undergoing their largest ever SPR drawdown, collapsing completely outside of the normal 5-year seasonal range as we head into June. If this heavy reliance on reserves goes on through the peak demand months of the summer, there are going to be structural supply consequences once those emergency buffers run dry. The broader market appears to be totally mispricing the severity of this structural drain right now. This is just one example of many.
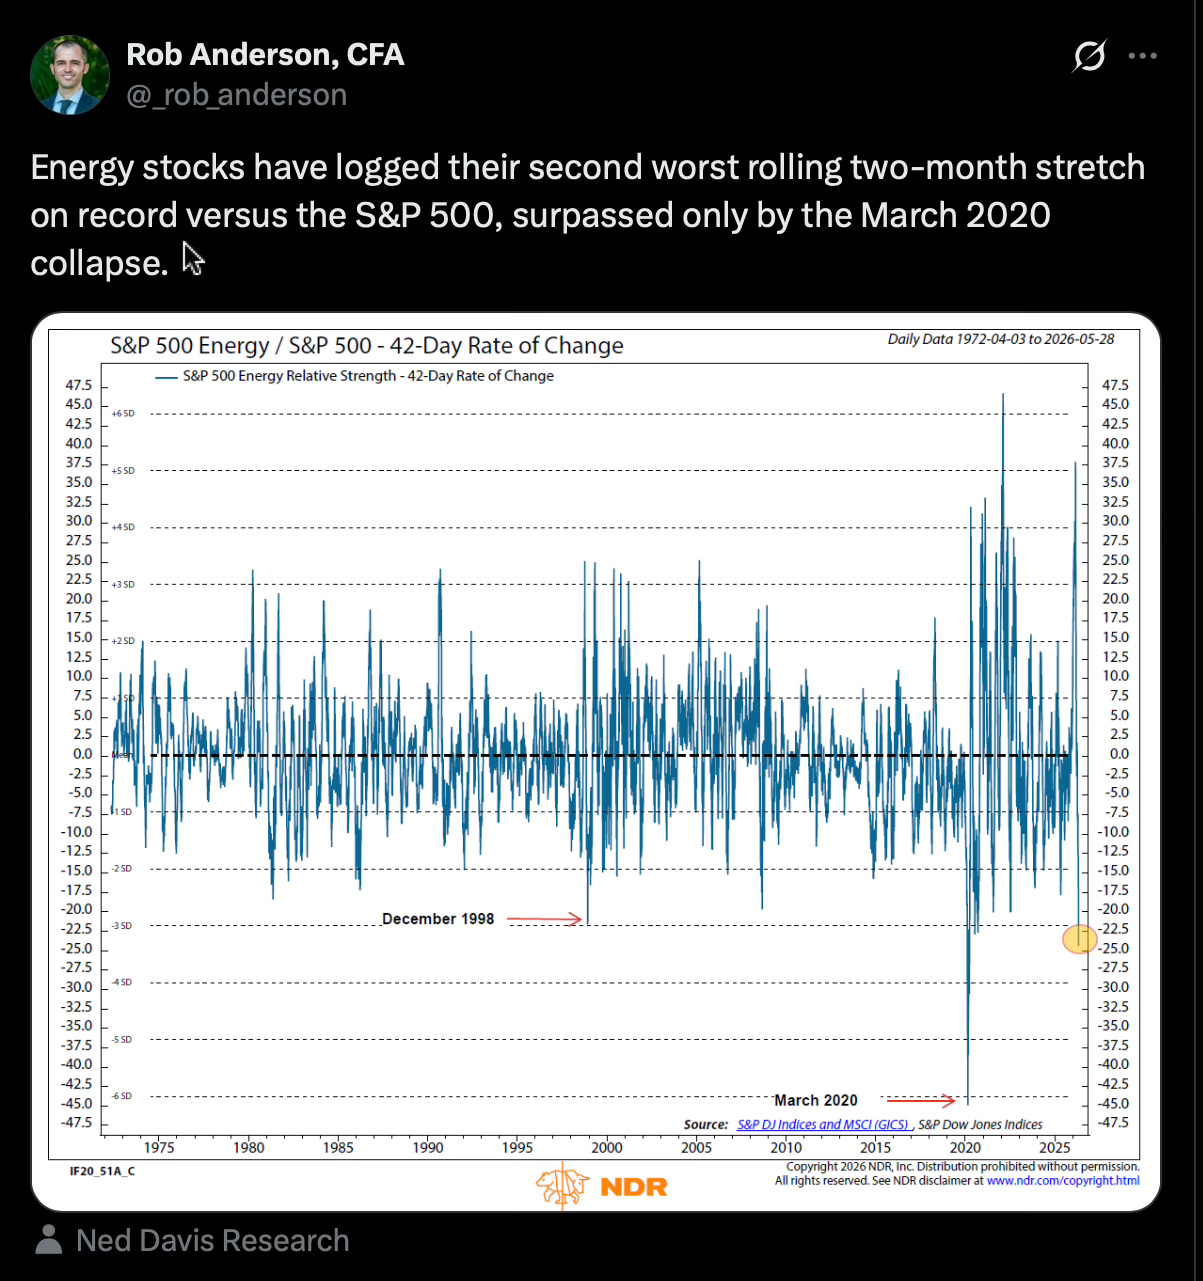
This chart provides a stark visual example of the current market disconnect. It shows that energy stocks have just logged their second-worst rolling two-month stretch on record relative to the S&P 500, surpassed only by the extreme pandemic collapse in March 2020. Even as underlying oil prices remain fundamentally strong, institutional capital continues to aggressively chase tech and AI. Virtually no one is focused on—or seems to care about—the actual physical commodities required to power and run this new digital infrastructure.
Weekly Watchlist
McFarlane Lake Mining - Market Cap $99 Million Canadian
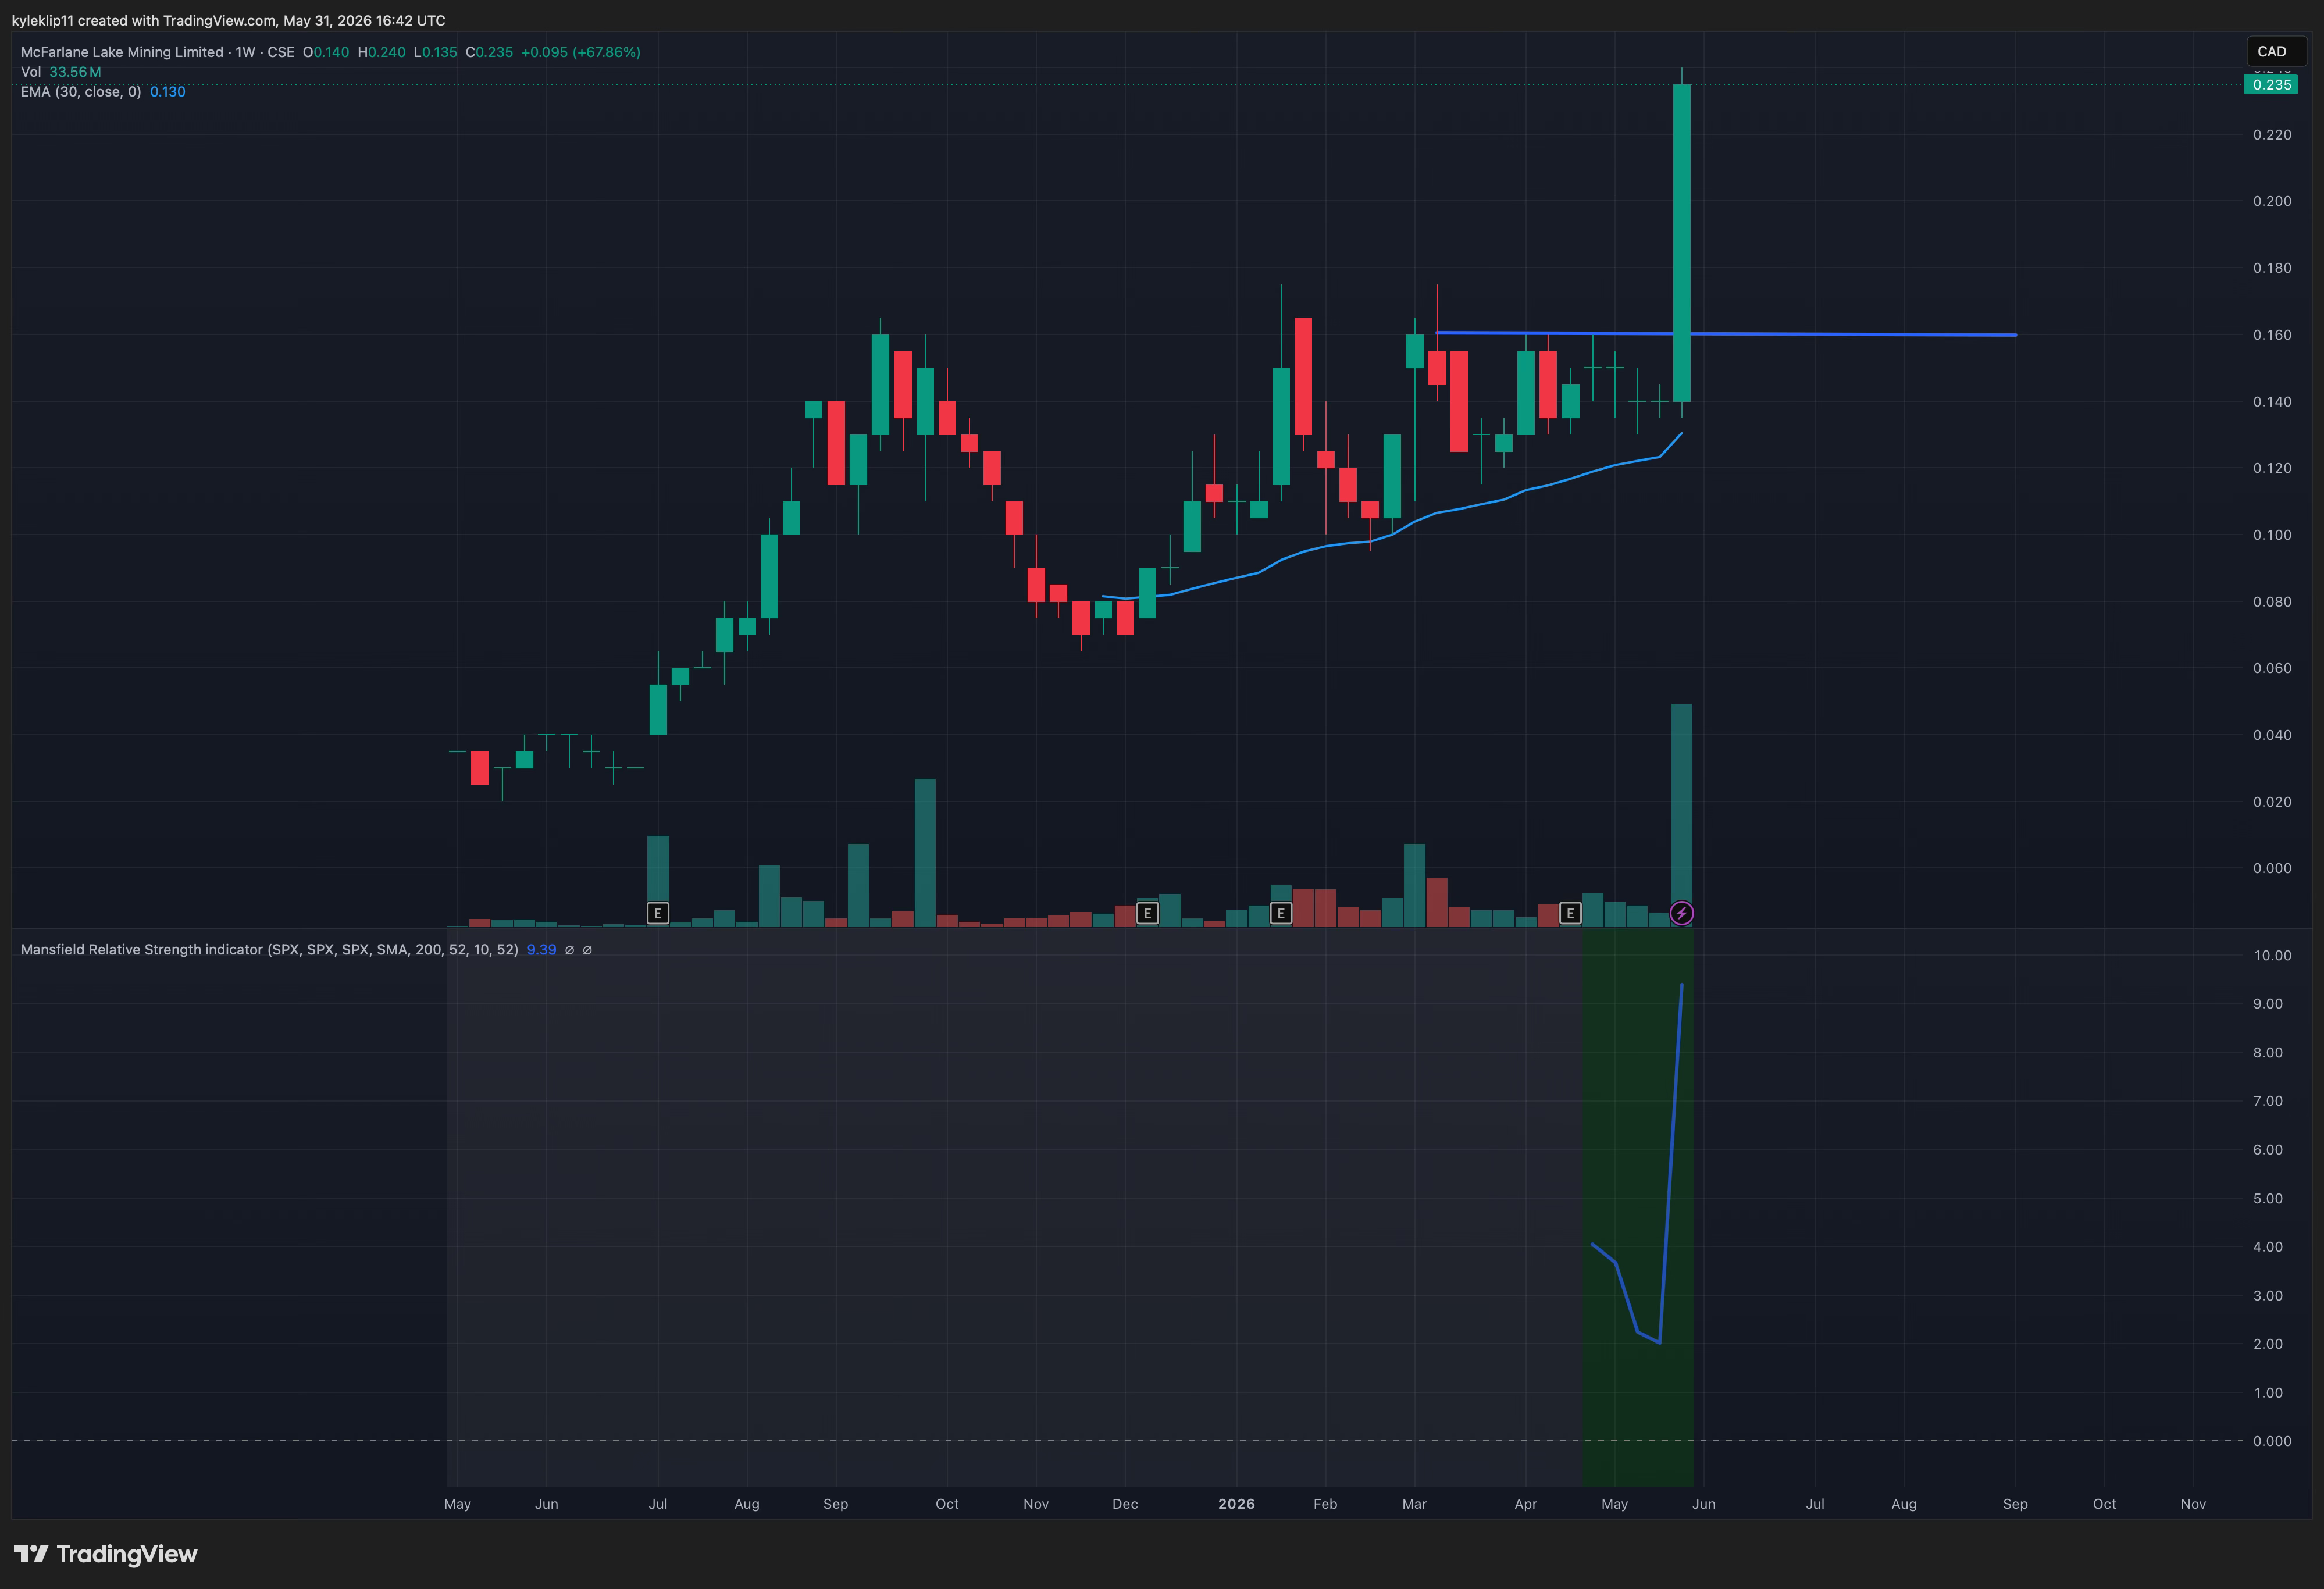
Looking at the technical setup, there is only about a year of clean chart data for this stock, but it broke out in a highly significant way this past week. We witnessed massive weekly volume drive the equity to all-time highs. With blue sky ahead and zero historical overhead resistance, the stock is showing a powerful relative strength breakout against the S&P 500 ($SPX) while trading well above its rising 30-week Exponential Moving Average (EMA). This configuration checks every single technical indicator I look for in a breakout candidate. It represents a textbook Stage 2 Breakout using the classic Stan Weinstein Method.
The fundamental engine driving this technical strength is the company’s 100%-owned flagship Juby Gold Project, located in the prolific Abitibi Greenstone Belt of Ontario. McFarlane released their Mineral Resource Estimate (MRE) in late 2025. That baseline model outlined a major gold inventory, including 1.01 million ounces of gold grading 0.98 g/t Au in the Indicated category, and an additional 3.17 million ounces of gold grading 0.89 g/t Au in the Inferred category. While the project already hosts over 4 million global ounces, management continues to believe the property has structural potential to aggressively expand this resource toward a long-term target of over 10 million ounces.
McFarlane has been exceptionally busy with the drill bit, delivering highly positive, thick, low-grade intercepts throughout the year so far—including standout runs like 136 meters of 0.67 g/t Au and 109.6 meters of 0.69 g/t Au at the Golden Lake deposit. The company is currently fast-tracking an updated Mineral Resource Estimate scheduled for release in June 2026. This upcoming model update will incorporate all recent drilling and is expected to add a significant amount of tonnage to what is already a highly substantial baseline resource. Furthermore, the company advanced its technical thesis this week by identifying a major geophysical anomaly along the 826 Zone trend. They plan to prioritize drilling out these newly defined priority targets, which look incredibly compelling for prospective step-out discoveries.
A C$6.75 million non-brokered private placement was announced on May 28, with the financing anchored by resource investor Michael Gentile and mining executive Pierre Beaudoin. Upon closing of the transaction, Gentile’s total holding is expected to represent 19.67% of the company on a partially diluted basis.
Gentile provided the following commentary regarding his investment decision:
“I am excited to make this major investment in McFarlane Lake and support the advancement of the Juby Gold Project. McFarlane Lake ticks all the boxes I look for in a mining project: size, scale, infrastructure, grade and compelling exploration upside all in a proven Tier 1 jurisdiction and trading at only a $60M market cap. I look forward to working closely with management to advance the asset and create long-term shareholder value.”
The introduction of this strategic funding effectively addresses the company’s near-term exploration treasury requirements. This capital inflow coincided with the high-volume technical breakout observed at the end of the trading week. It will be interesting to watch and see how many ounces they add in the June estimate.
The free section of this week's report concludes here. Everything below this is reserved for paid subscribers. In the premium section, we dive into a notable breakout in the fertilizer sector, along with additional market notes and commentary.