Weekly Watchlist - May.24, 2026
Two unique critical metal setups breaking out of short term ranges.

GR Silver Mining - Market Cap $208 Million
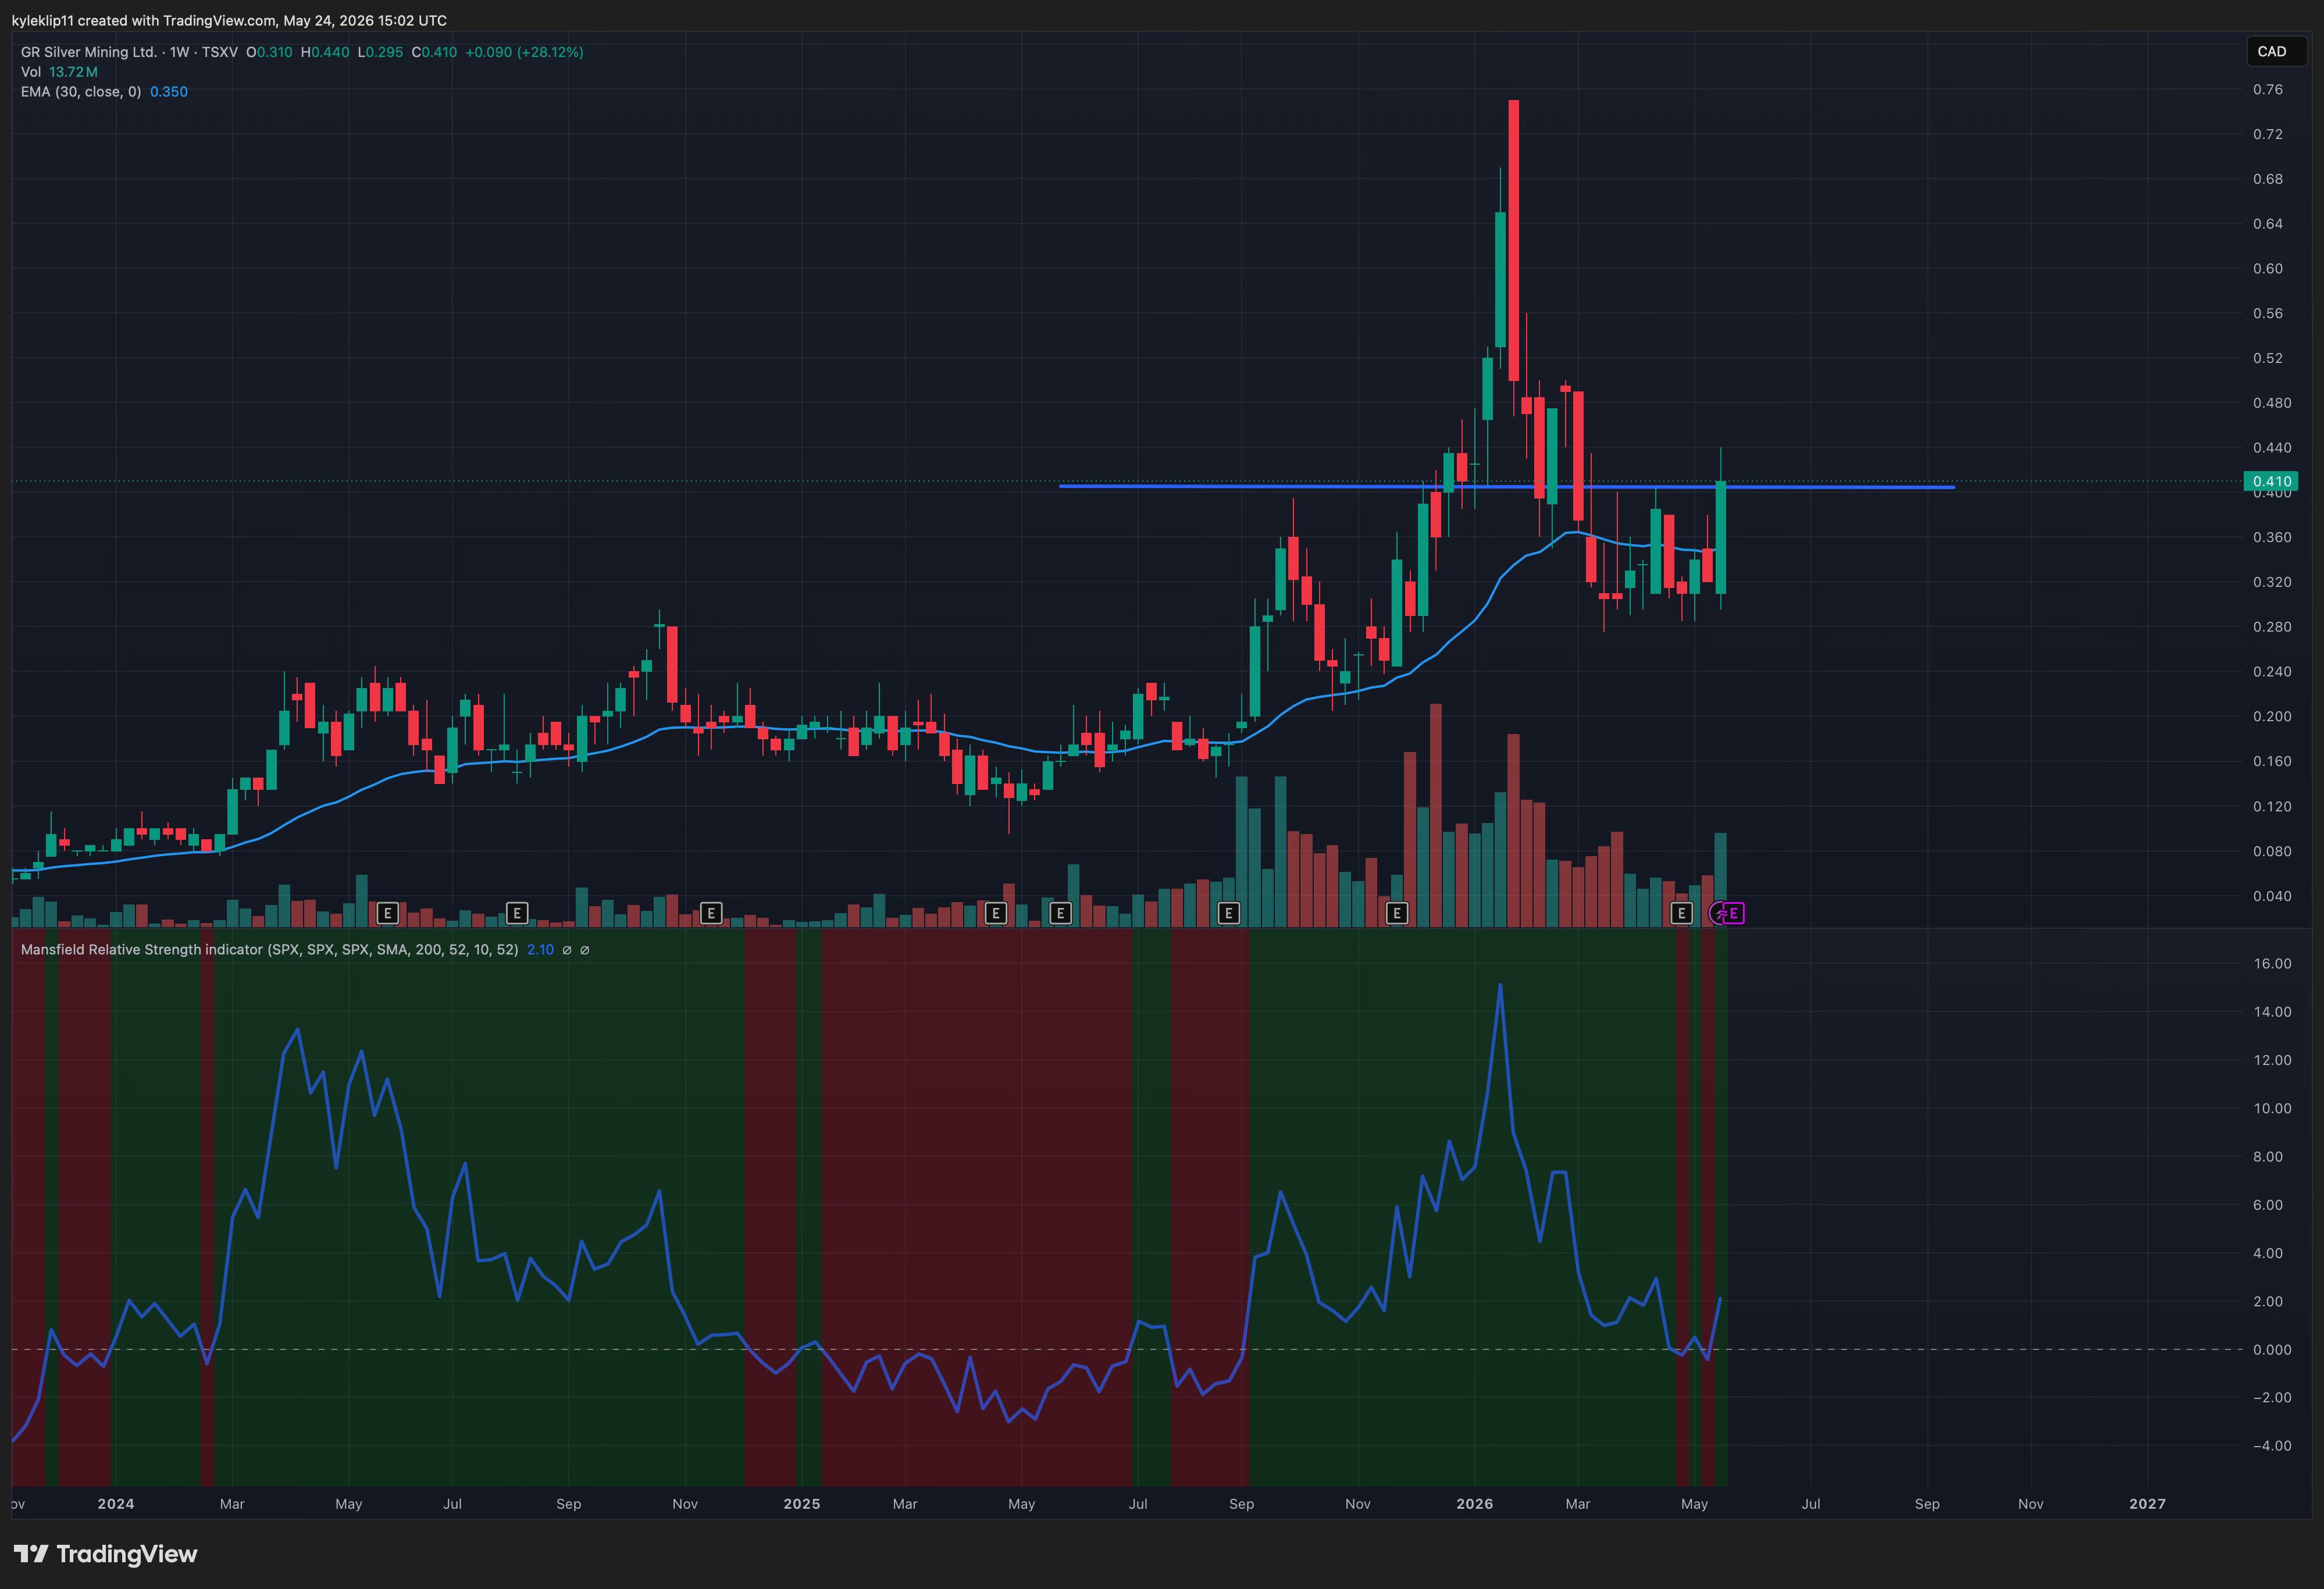
GR Silver put in a great technical setup this week, breaking out cleanly from its short-term trading range on a nice uptick in volume. Getting above the 30-week EMA and showing relative strength against the $SPX again are exactly the kind of signals that point to a real shift in trend.
The fundamentals back up the price action. The core asset is the past-producing Plomosas project in Mexico, which already boasts a substantial mineral resource of over 134 million ounces of silver equivalent. Because it is a brownfield site, the project is fully permitted and has massive infrastructure already in place. Having kilometers of underground tunnels, a camp, and tailings facilities ready to go completely changes the economics, drastically lowering upfront capital costs and speeding up the timeline to production.
The big mover right now is the spectacular drill results released on May 19. They hit a absolute monster of a hole at San Marcial—45.1 meters of 1,623 g/t silver, including a tight zone of over 8,500 g/t. Hitting grades and widths like that in step-out drilling proves the system has massive potential to expand well beyond the current resource footprint.
The pipeline for the rest of the year is incredibly tight. The company recently got confirmation from Mexican regulators that they do not need a new environmental impact authorization to advance, since they are rehabilitating historical workings. This clears a massive bureaucratic hurdle. Once the current 20,000-meter drill program wraps up, they plan to release an updated resource estimate alongside a new Preliminary Economic Assessment (PEA) before the end of the year. Combined with their ongoing engineering for a 250 to 600 ton-per-day modular pilot plant, they are actively setting up a clear path toward commercial production.
Mkango Resources - Market Cap $375 Million
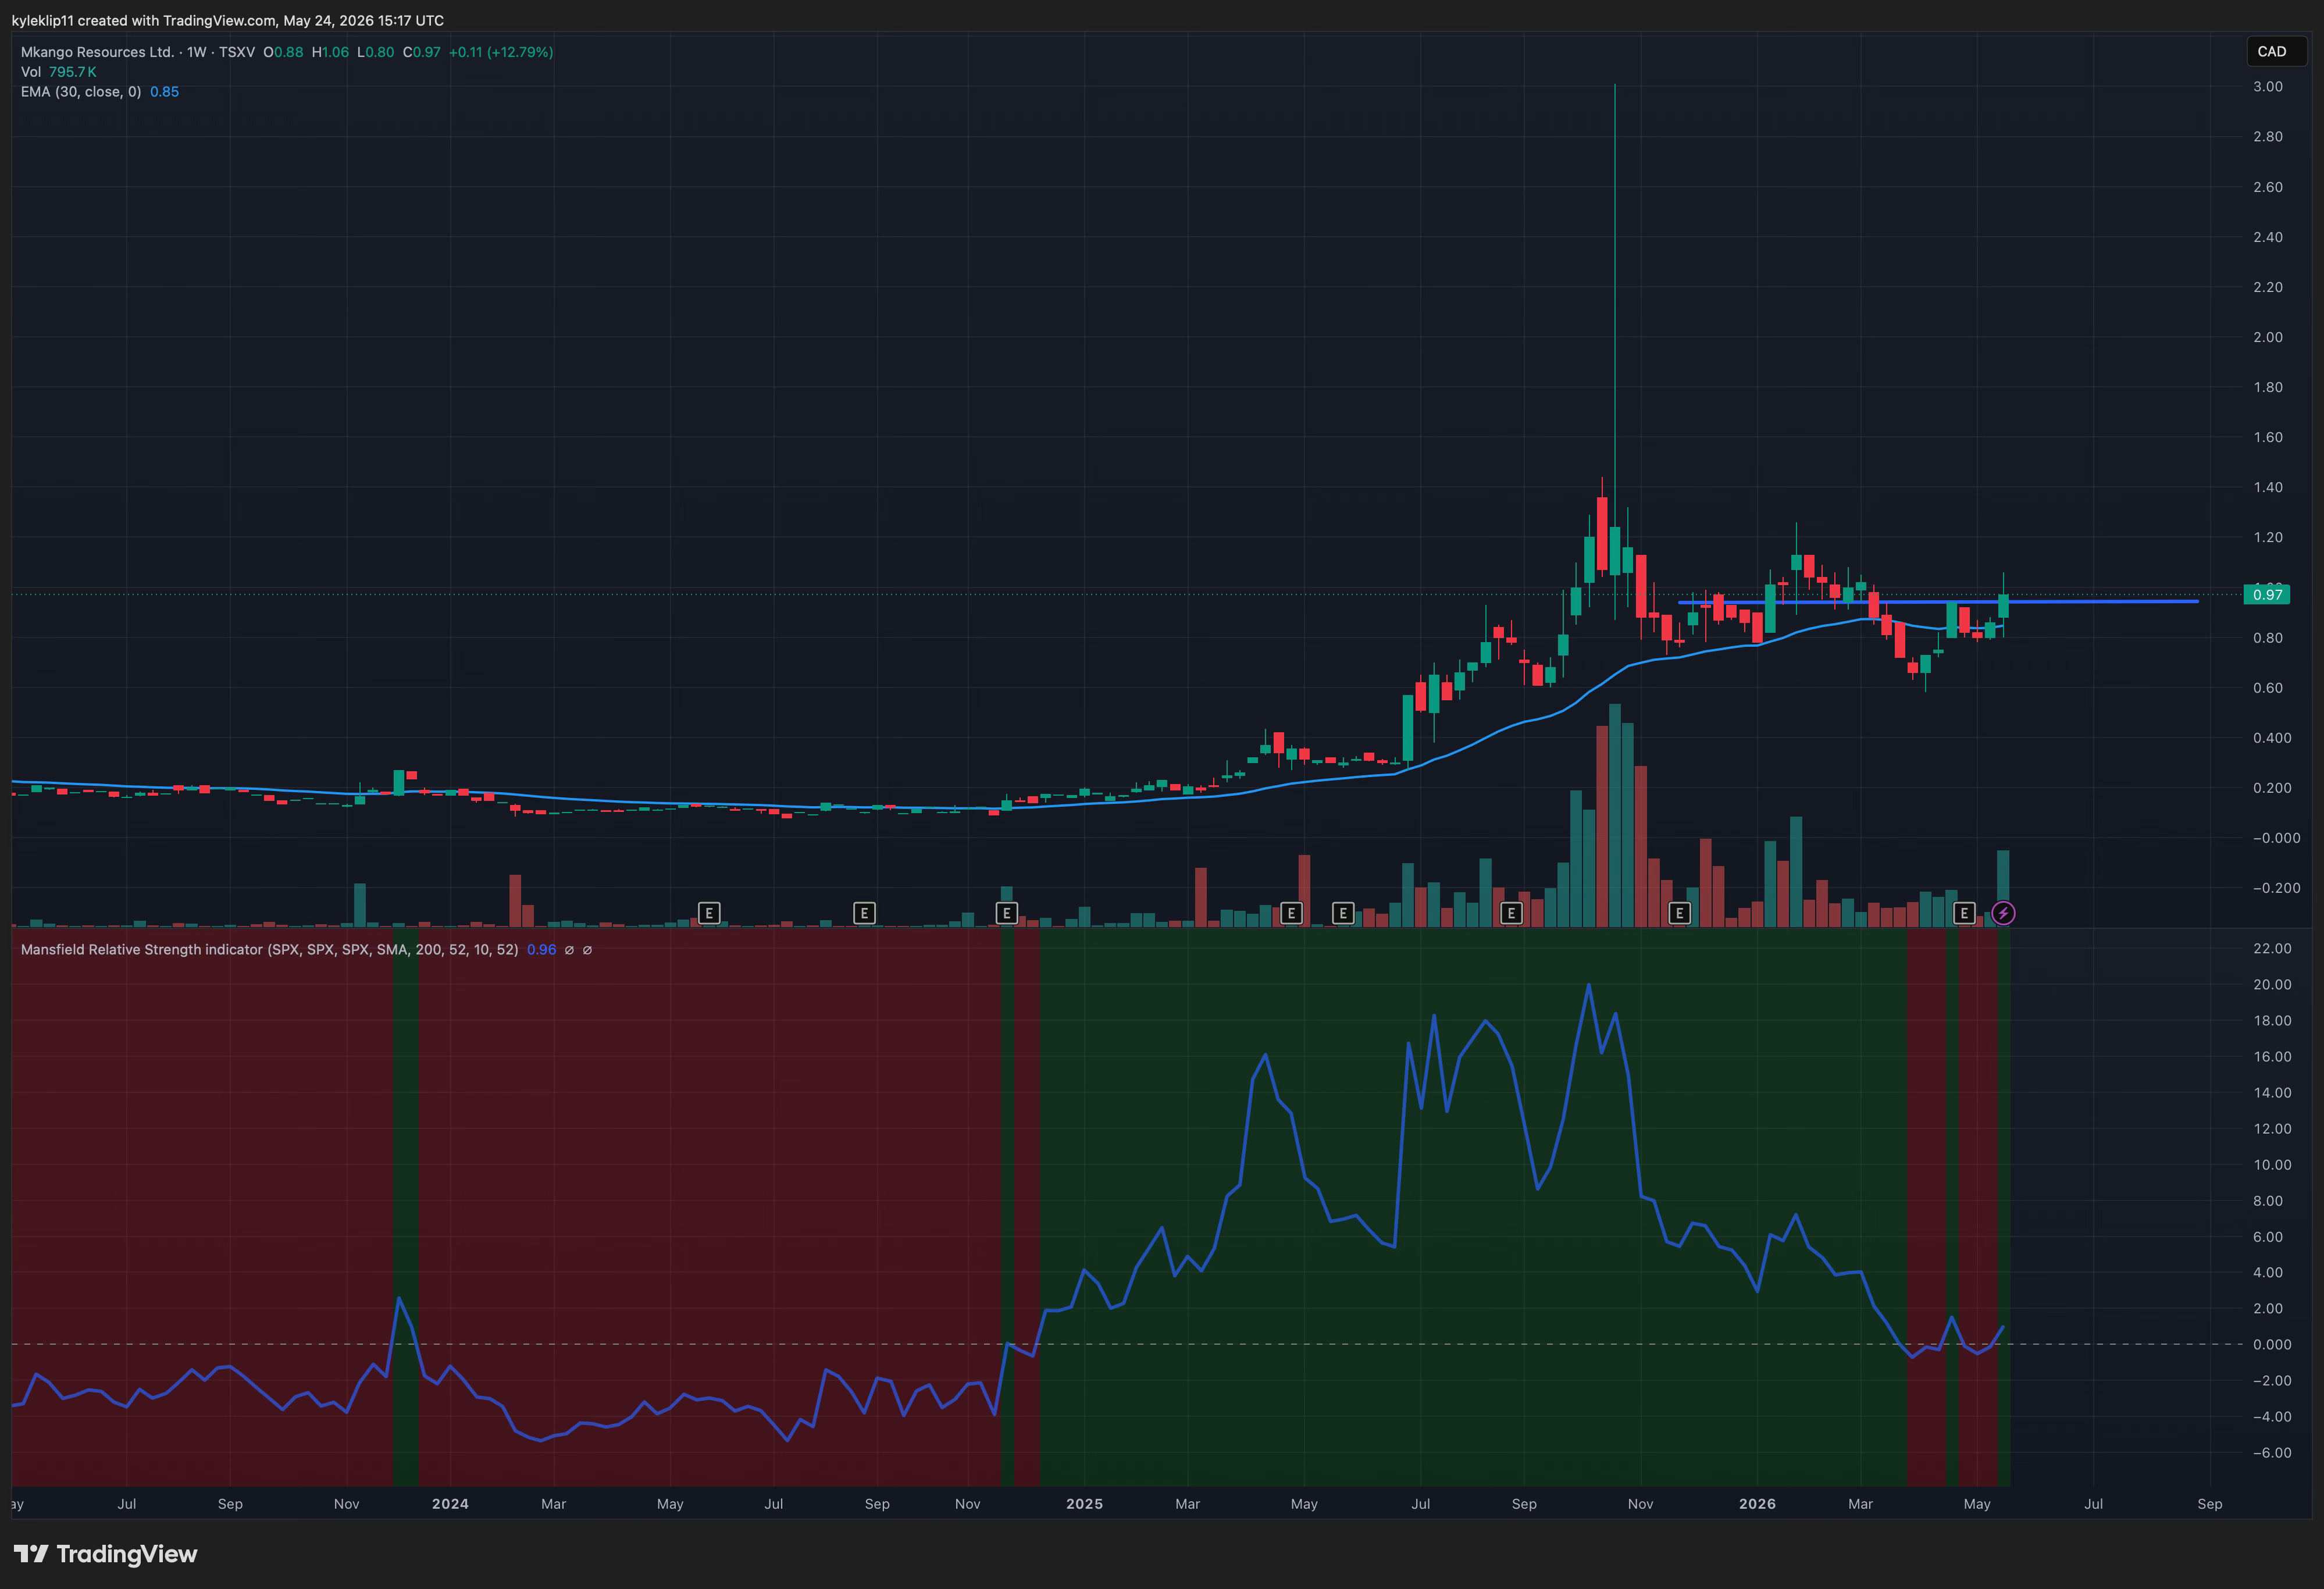
Mkango is another name breaking out of its short-term trading range on a major volume anomaly. It has cleanly broken out against the $SPX and is trading well above its 30-week EMA. This setup is a classic, simple recipe, but it consistently produces strong results if you stick to the discipline of buying when the price action and volume align like this.
The fundamentals here offer a highly unique story. Mkango is aggressively targeting a very specific, high-margin niche: rare earth magnet recycling. They already have a processing facility up and running in the UK and are currently in the final commissioning stages for a commercial-scale plant in Germany. They are also moving quickly on plans to construct a massive manufacturing hub in America. According to their updated engineering studies, the proposed US facility carries a massive post-tax NPV (7% discount rate) of $780 million USD based on forecast pricing ($409 million USD at current spot prices).
A major near-term catalyst is their upcoming corporate spin-out. The company is actively listing its recycling and development subsidiary on the Nasdaq this quarter under the ticker MKAR. This move is an immediate game-changer for the story, driving massive visibility and tapping into deep US institutional liquidity that standard junior markets simply can’t offer.
Because production is just getting off the ground and ramping up in both Germany and the UK as the year goes on, the company is sitting right at a major operational inflection point.
Beyond the recycling side, they have a massive backstop in their 100%-owned Songwe Hill rare earth project in Malawi. This is an advanced-stage asset backed by a completed Definitive Feasibility Study (DFS). The open-pit project hosts a proven and probable reserve of over 18.1 million tonnes grading 1.16% Total Rare Earth Oxides, delivering a robust $339 million USD post-tax NPV at a 10% discount rate.
Notes from the week.
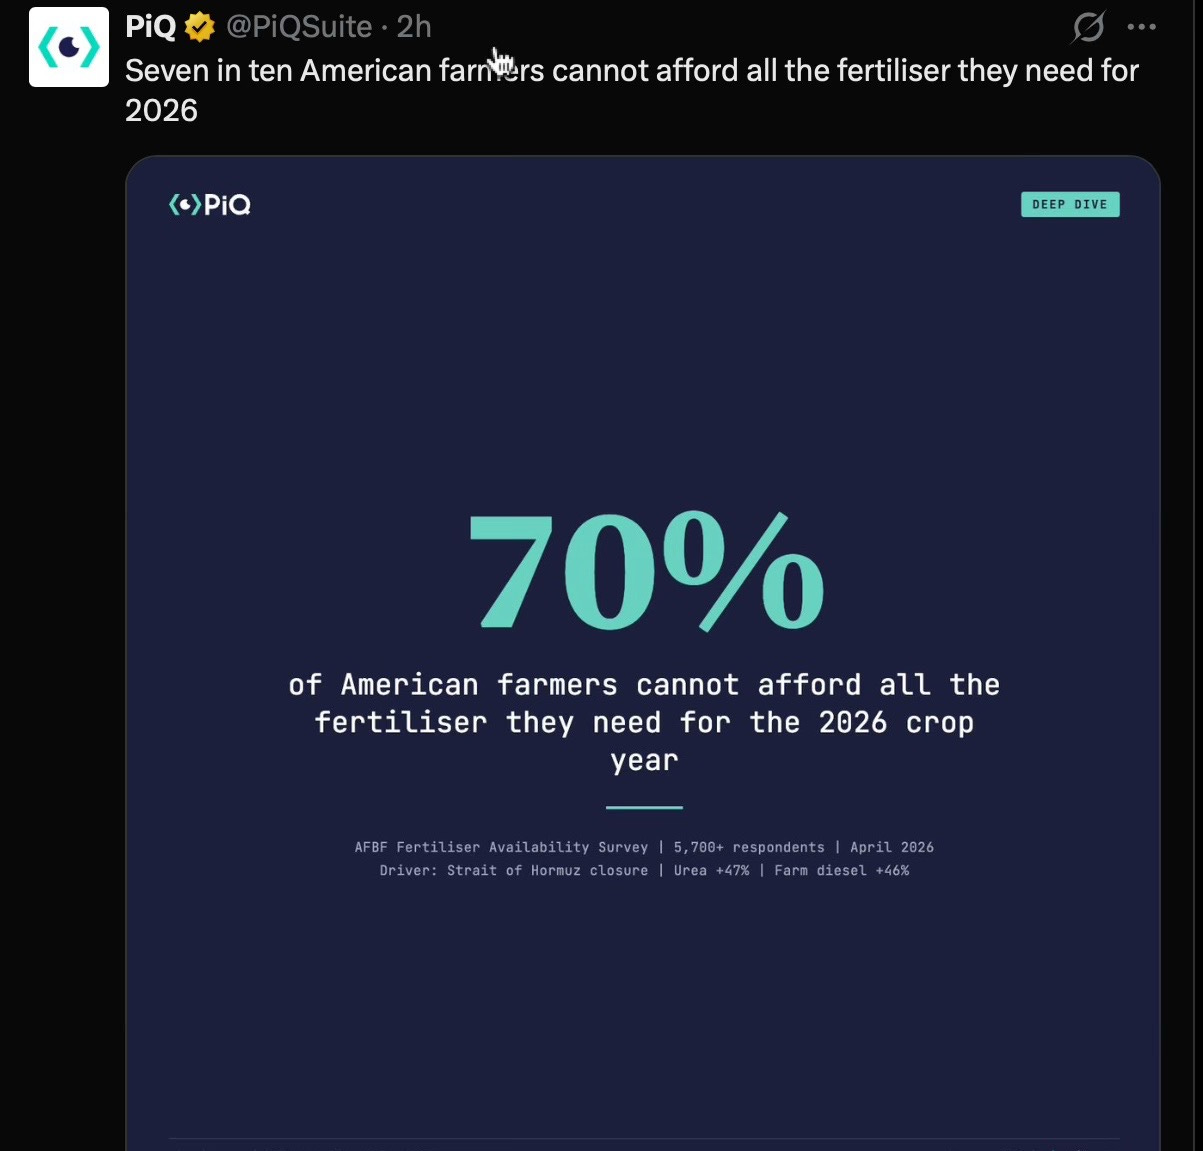
According to an April 2026 AFBF survey of over 5,700 respondents, 70% of American farmers can no longer afford the fertilizer required for the 2026 crop year. The primary driver is a massive supply-chain shock following the closure of the Strait of Hormuz, which has sent urea prices up 47% and farm diesel up 46%.
When 70% of operators are priced out of full fertilizer applications, they are forced to either cut back on nutrients or reduce acreage. Both options lead directly to lower crop yields and tighter global supplies.
Because agriculture sits at the very base of the supply chain, these surging input costs create a textbook cost-push inflation cycle. It takes roughly 6 to 12 months for these farm-gate pressures to work their way through processors and distributors, meaning this data points to a highly stubborn, lagging floor under food prices well into 2027.
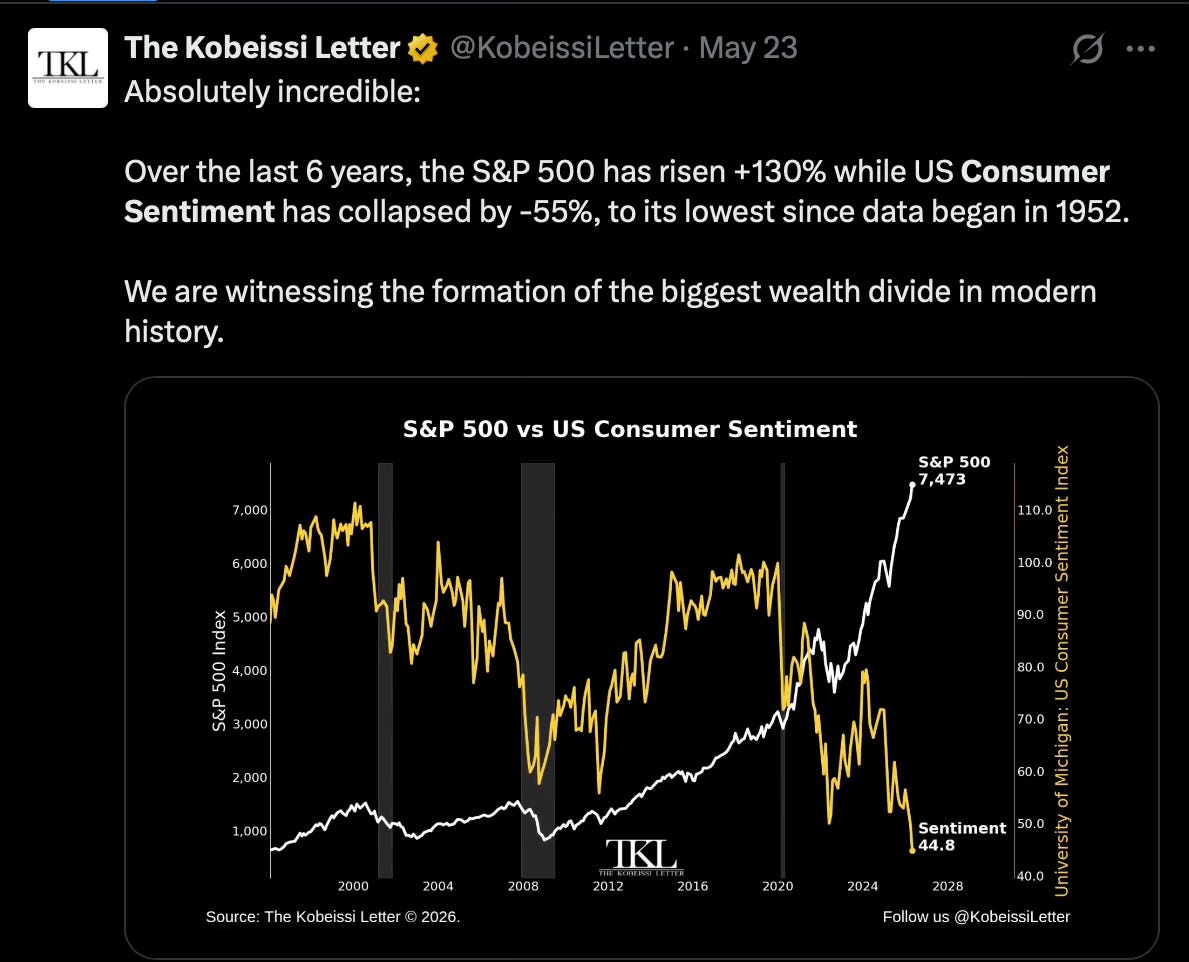
This chart perfectly visualizes the unprecedented divergence between Wall Street and Main Street. Over the last six years, the S&P 500 has surged +130% while US Consumer Sentiment has collapsed by -55%, hitting an all-time low of 44.8—a level worse than the 2008 financial crisis or 1970s stagflation.
This disconnect highlights a stark reality: the stock market is a reflection of asset inflation, not the health of the broader population. Because the top 10% of Americans own over 90% of all stocks, record-high markets do nothing to alleviate the daily pressures facing the middle and lower classes. While corporate earnings expand, the average consumer is being crushed under the cumulative weight of soaring housing costs and everyday inflation, creating the largest wealth divide in modern history.
An update on the future of Mining Charts
As Mining Charts continues to grow, it is taking up more time to put these reports together. I have a lot of new ideas for the publication, and I want to dedicate more time to digging into the charts, deep-diving more positions, and making the weekly reports more thorough.
To make putting this extra time and research into the letter sustainable, I am introducing a paid option starting next week.
How it will work: I want to keep this letter accessible, so I will always send out one full stock chart setup completely free every weekend.
If you want full access—which includes the expanded 2–3 stock weekly watchlist and the deeper position analysis—that will be behind a paid tier of $10 USD a month (or $90 a year).
Note on pricing: If you choose to support the letter and subscribe during this initial transition, your rate will be permanently locked in at $10 a month for as long as you keep your subscription active. Even as the publication grows and the price increases for new readers in the future, your price will never change.
To those who have already pledged your support over the past year—thank you. Substack will handle the transition automatically over the next few days, so you don’t need to do anything.
Disclaimer
The content on this website is provided for educational and informational purposes only and does not constitute financial, investment, or other professional advice. Nothing contained on this website should be construed as a recommendation to buy, sell, or hold any security or financial product. The author is not a licensed financial advisor or broker-dealer. The author may hold positions in securities mentioned and may change those positions at any time without notice. All information is provided in good faith; however, we make no representation or warranty, express or implied, regarding the accuracy, adequacy, validity, reliability, availability, or completeness of any information on this website. Content is provided “as is” and may contain errors or omissions. Past performance is not indicative of future results. Investing involves risk, including the potential loss of principal. You should conduct your own research and consult with a qualified financial professional before making any investment decisions. Under no circumstances shall we be liable for any loss or damage (including financial loss) incurred as a result of the use of, or reliance on, any information provided on this website. Your use of this website and your reliance on any information is solely at your own risk.